Oct 29, 2025
9 0
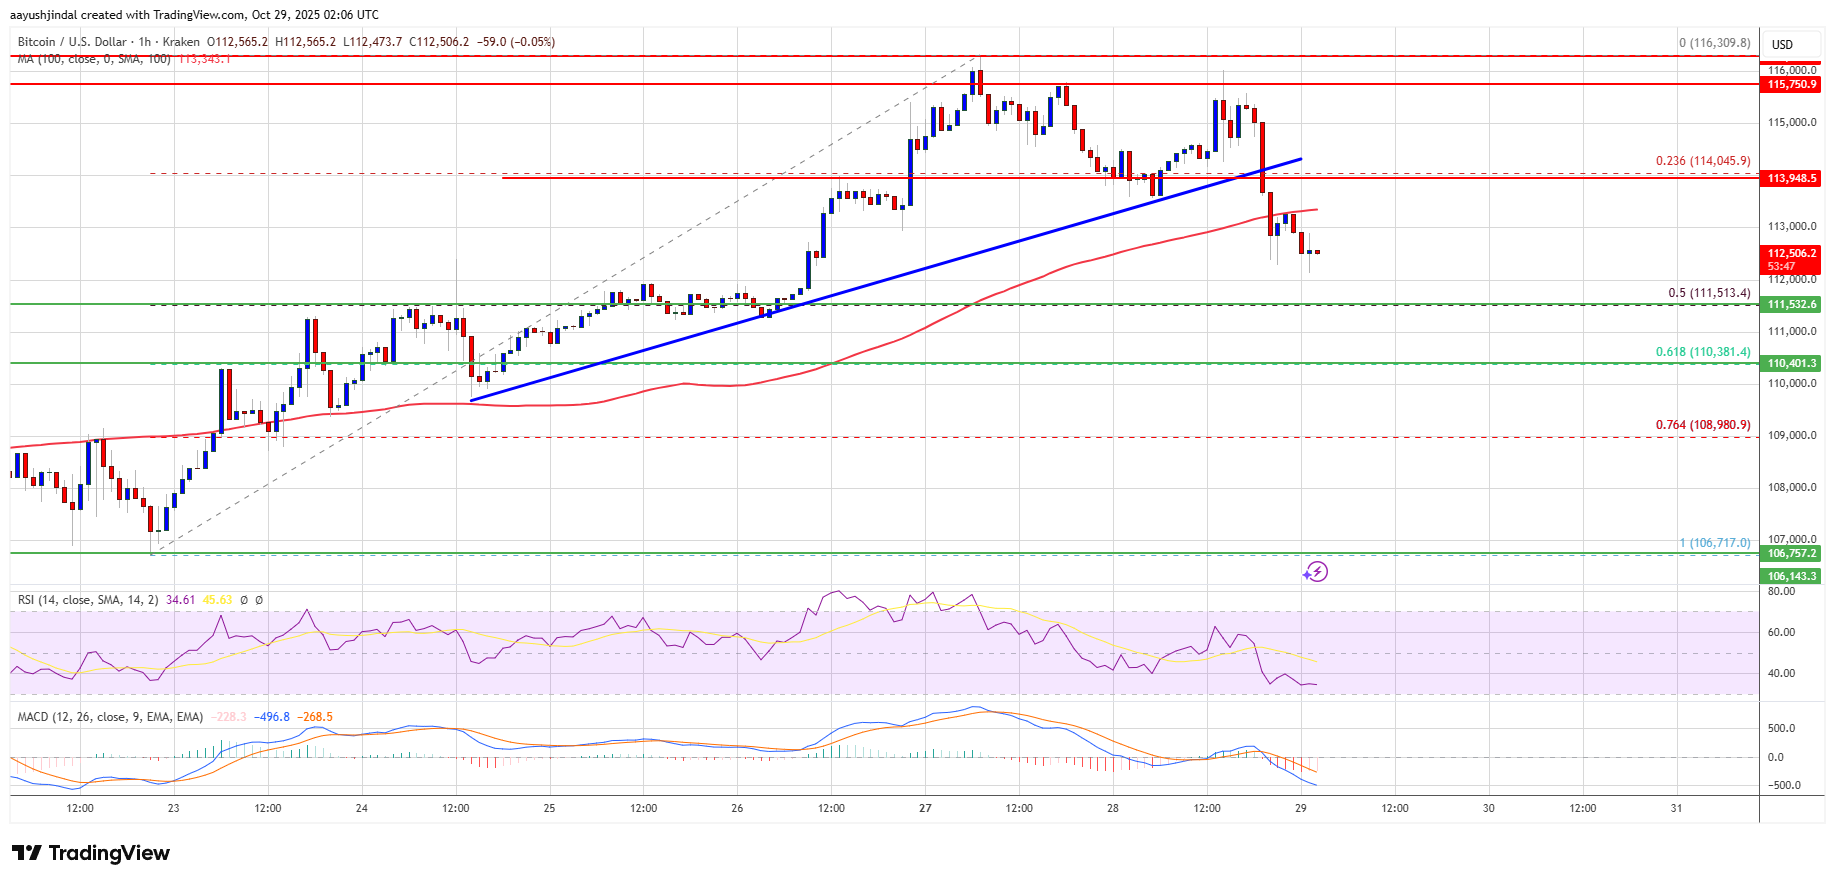
Bitcoin Corrects Below $114,200 Resistance Amid Price Pullback
Bitcoin is experiencing a price correction, moving below key resistance levels.
- The price has fallen below $114,000 and the 100 hourly Simple Moving Average.
- A break occurred below a bullish trend line with support at $114,050 on the BTC/USD pair chart.
- If trading continues below $112,000, further downward movement is likely.
Current Price Movement
Bitcoin recently spiked above $116,200 but faced resistance. A high was noted at $116,309 before the price started correcting below $114,200. It is now below $114,000.
Immediate resistance levels include:
- $113,650
- $114,200
- $115,000 - A close above this could push the price towards $116,200 and possibly $117,500.
Potential for Further Losses
- If Bitcoin fails to surpass $114,200, it may continue to decline.
- Support levels are at $112,000, $111,500, $110,500, and $108,500.
- Major support at $108,500 might pose challenges for recovery if breached.
Technical Indicators
- Hourly MACD is bearish.
- Hourly RSI is below 50.
- Major Support Levels: $112,000, $111,500.
- Major Resistance Levels: $114,200, $115,000.