Feb 23, 2026
3 0
BEARISH 📉 : Bitcoin dips over 5%, struggles below $66,500 support
Bitcoin's price has experienced a significant decline, failing to stay above $68,000 and currently consolidating losses.
- The price dropped below $66,500 support and is trading under the 100 hourly simple moving average.
- A break occurred below a bullish trend line with support at $68,000 on the BTC/USD hourly chart.
- The price formed a low at $64,203 and is attempting to correct losses, but remains below the 23.6% Fib retracement level from $68,653 to $64,203.
Resistance and Support Levels:
- Immediate resistance is at $65,250, with key resistance at $66,400 (50% Fib retracement level).
- If BTC closes above $66,400, it could rise to test the $67,000 and potentially $67,600 levels.
- Further gains might lead to testing $68,000 and $68,500 barriers.
- If unable to rise above $66,000, Bitcoin may decline again with immediate support at $64,400 and major support at $64,200.
- Additional support zones are at $63,500 and $62,850, with main support now at $62,000, which could hinder recovery.
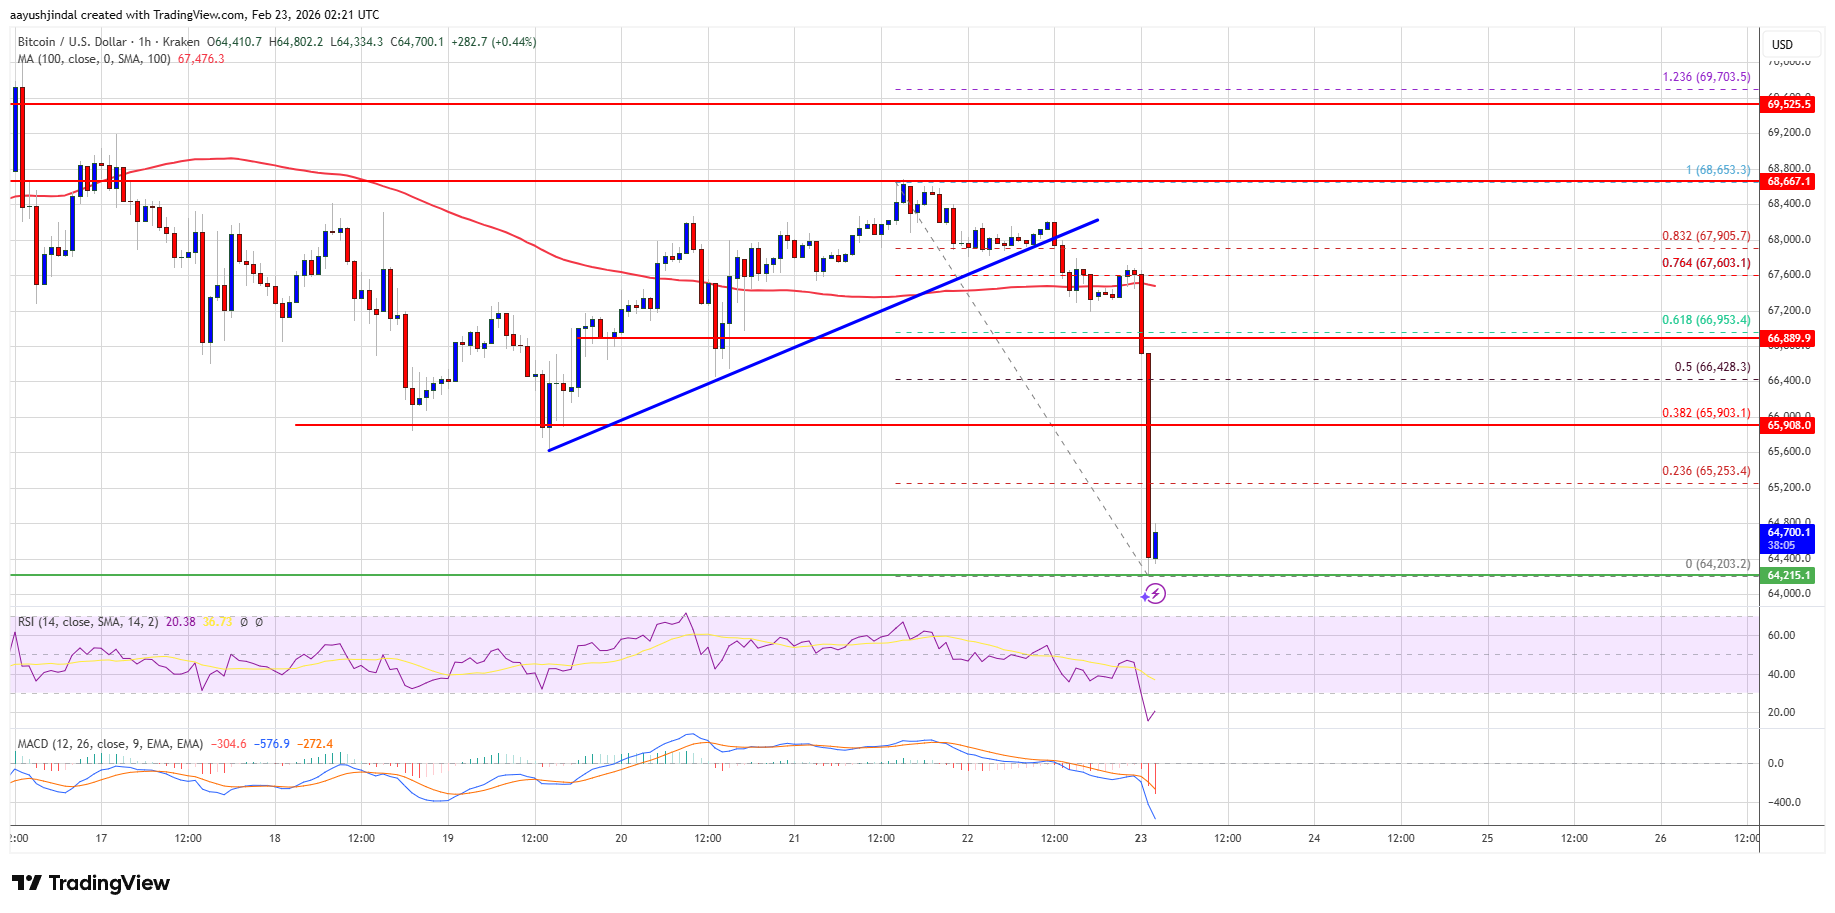
Technical Indicators:
- Hourly MACD: Gaining pace in the bearish zone.
- Hourly RSI: Below the 50 level for BTC/USD.