Jan 30, 2025
8 0
Bitcoin Price Forms Double Bottom Pattern with Potential to Reach $112,000
TradingView analyst ‘TradingShot’ reports that Bitcoin has formed a Double Bottom pattern, potentially leading to a new All-Time High (ATH) of $112,000. This follows a recent price drop below $100,000, which was influenced by the popularity of the AI model DeepSeek.
Key Developments
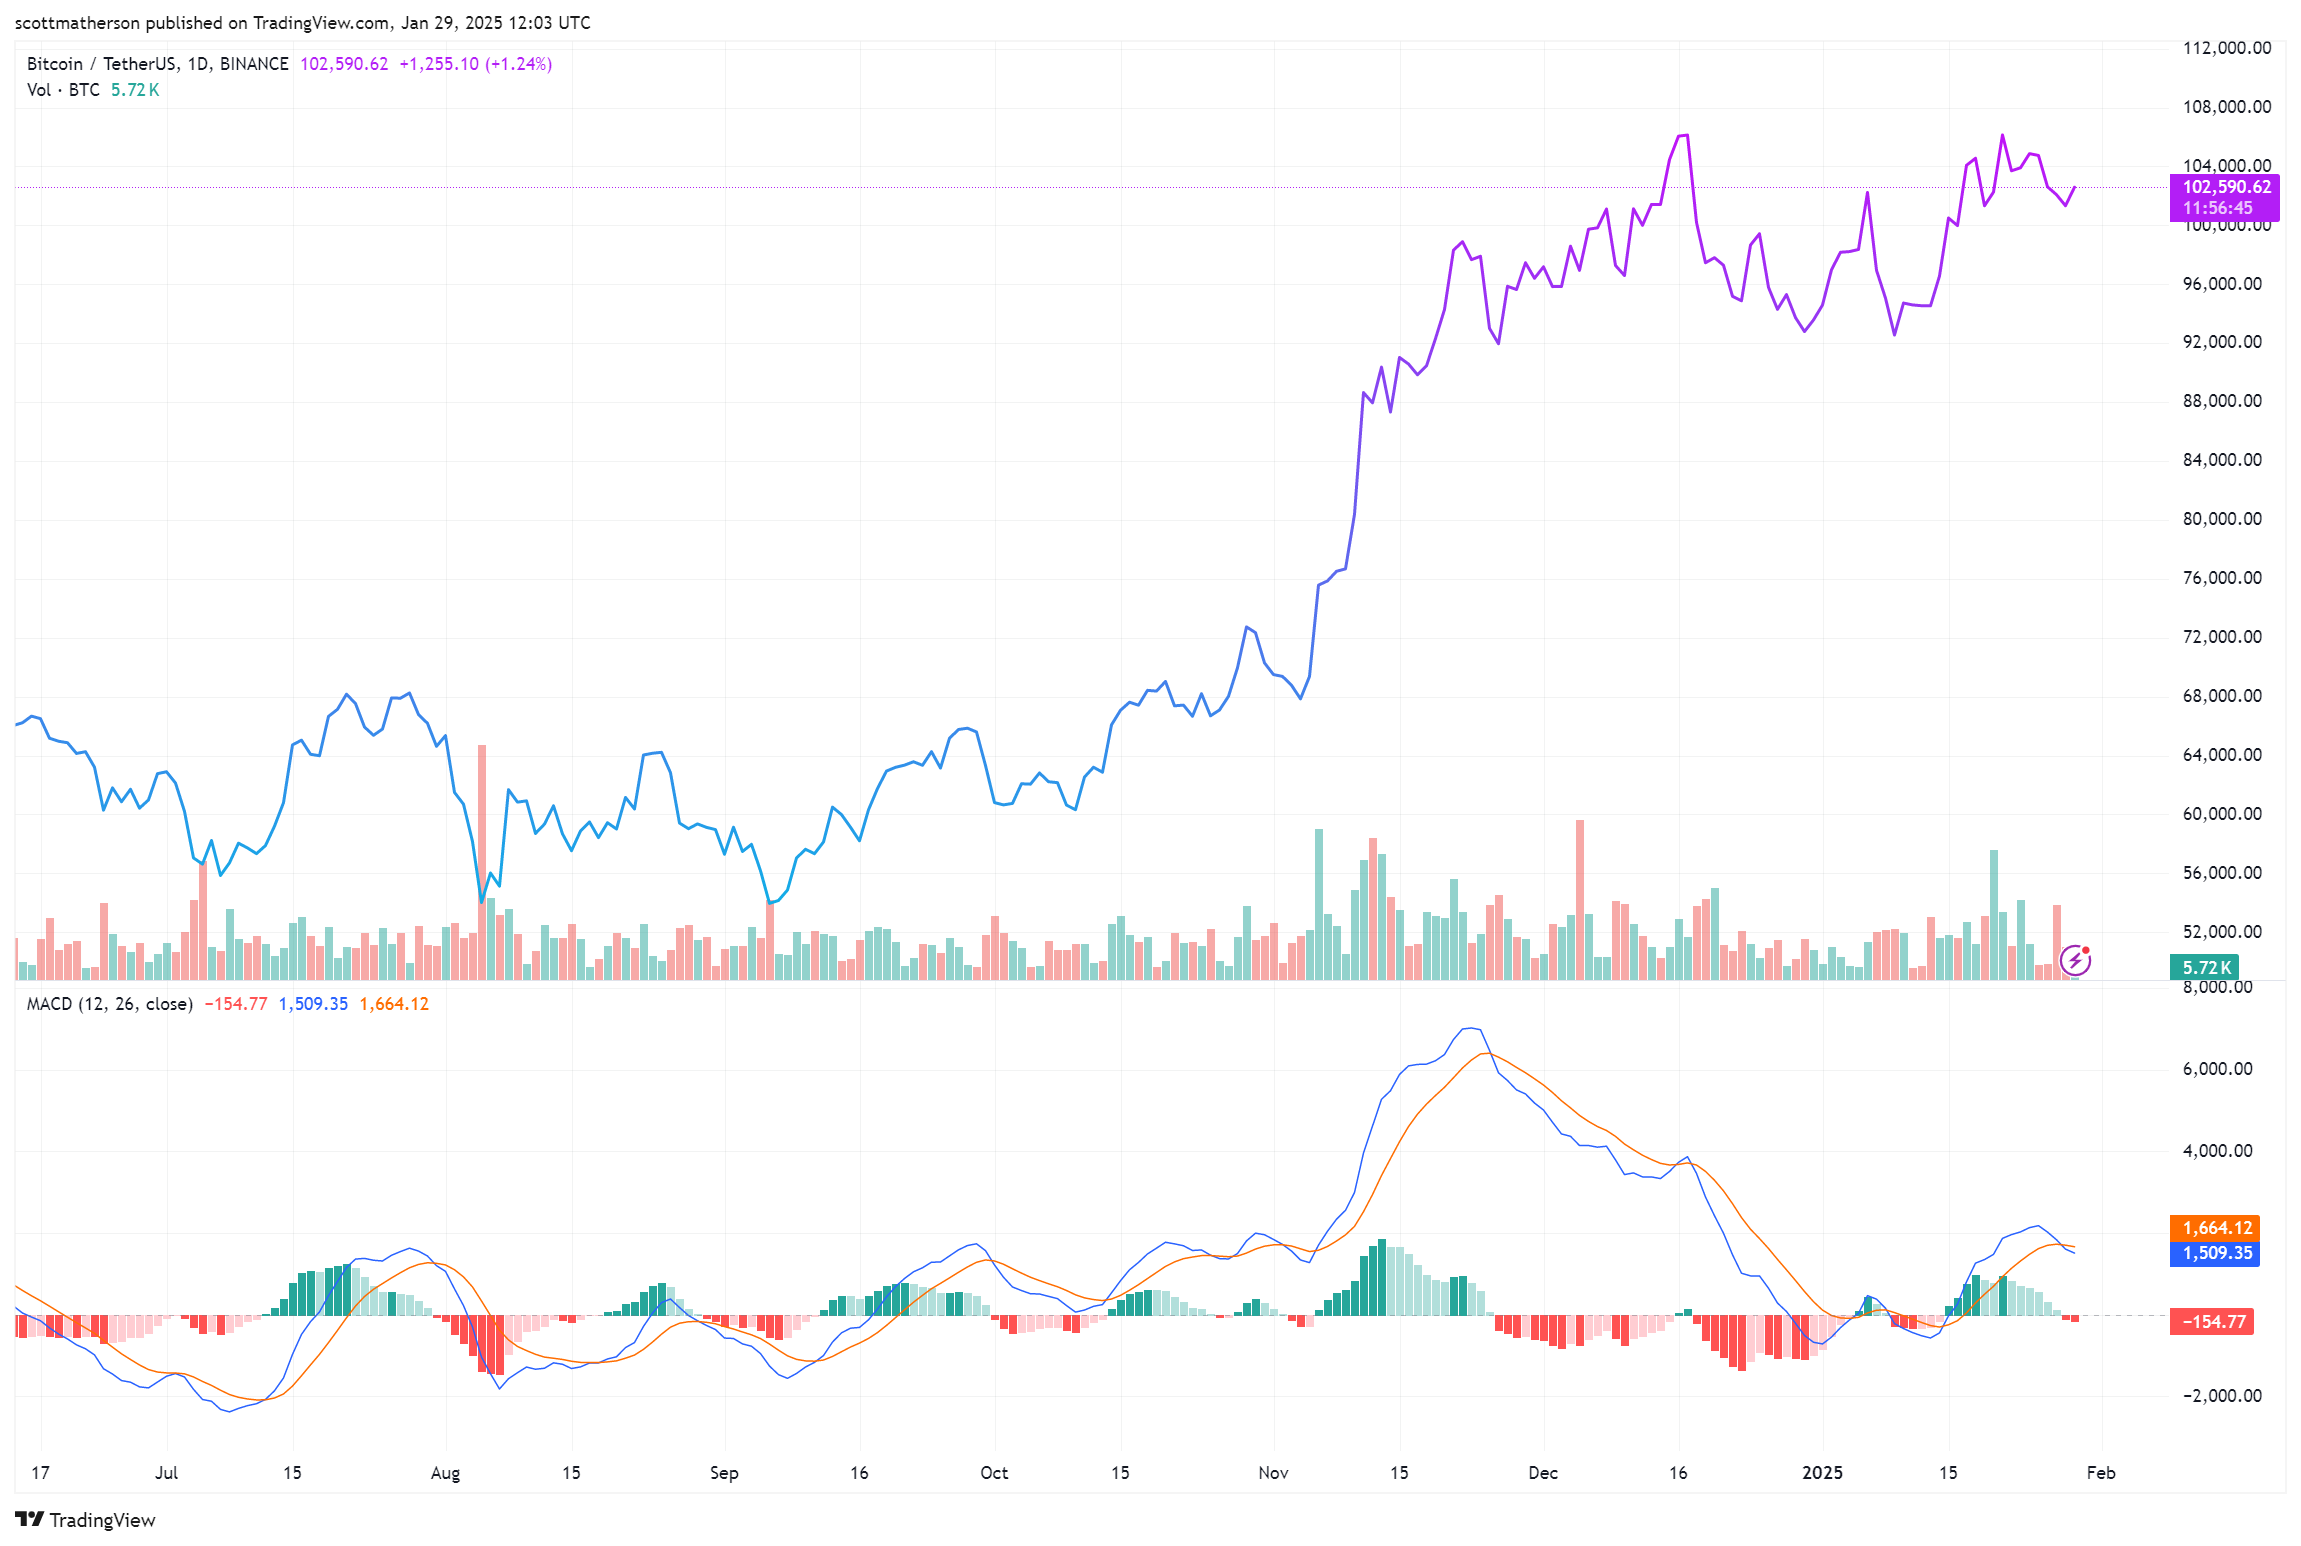
- Bitcoin price briefly fell below $100,000, causing a massive sell-off.
- Despite this decline, Bitcoin rebounded over 50% shortly after.
- The cryptocurrency is showing signs of recovery at a Double support level identified by TradingShot.
- A Double Bottom pattern indicates a possible trend reversal from downtrend to uptrend.
- Current trading shows an Ascending Channel, suggesting an overall upward movement.
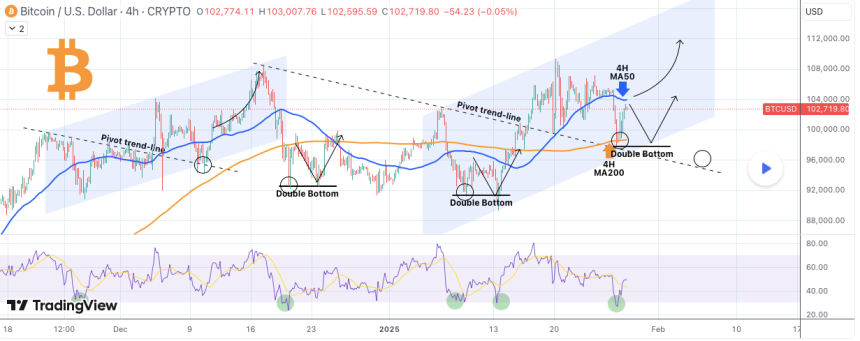
The 4H MA200 serves as a significant support level. A Pivot trend line previously acting as resistance now supports Bitcoin's price action. The cryptocurrency's price nearly touched January’s Channel Up bottom, indicating a key support zone similar to past patterns.
Resistance Levels and Predictions
- The 4H MA50 is currently acting as dynamic resistance.
- A breakout above the 4H MA50 could propel Bitcoin towards $110,000 to $112,000.
- If rejected at the 4H MA50, Bitcoin may revisit the Double Bottom around $98,000.
- Further declines could lead to a crash down to $96,000.
- Bitcoin's Relative Strength Index (RSI) suggests oversold conditions, indicating potential for a rebound.