Bitcoin Experiences Significant Drawdowns During Bull Market Cycles
This is a segment from the Empire newsletter.
Bitcoin Price Corrections During Bull Markets
Bitcoin frequently experiences significant price corrections, often around 80% from peak to trough in bear markets. However, this analysis focuses on corrections during bull markets, particularly the current cycle.
The following charts illustrate Bitcoin's performance across various timeframes, from three days to three months, starting at market troughs and moving toward all-time highs.
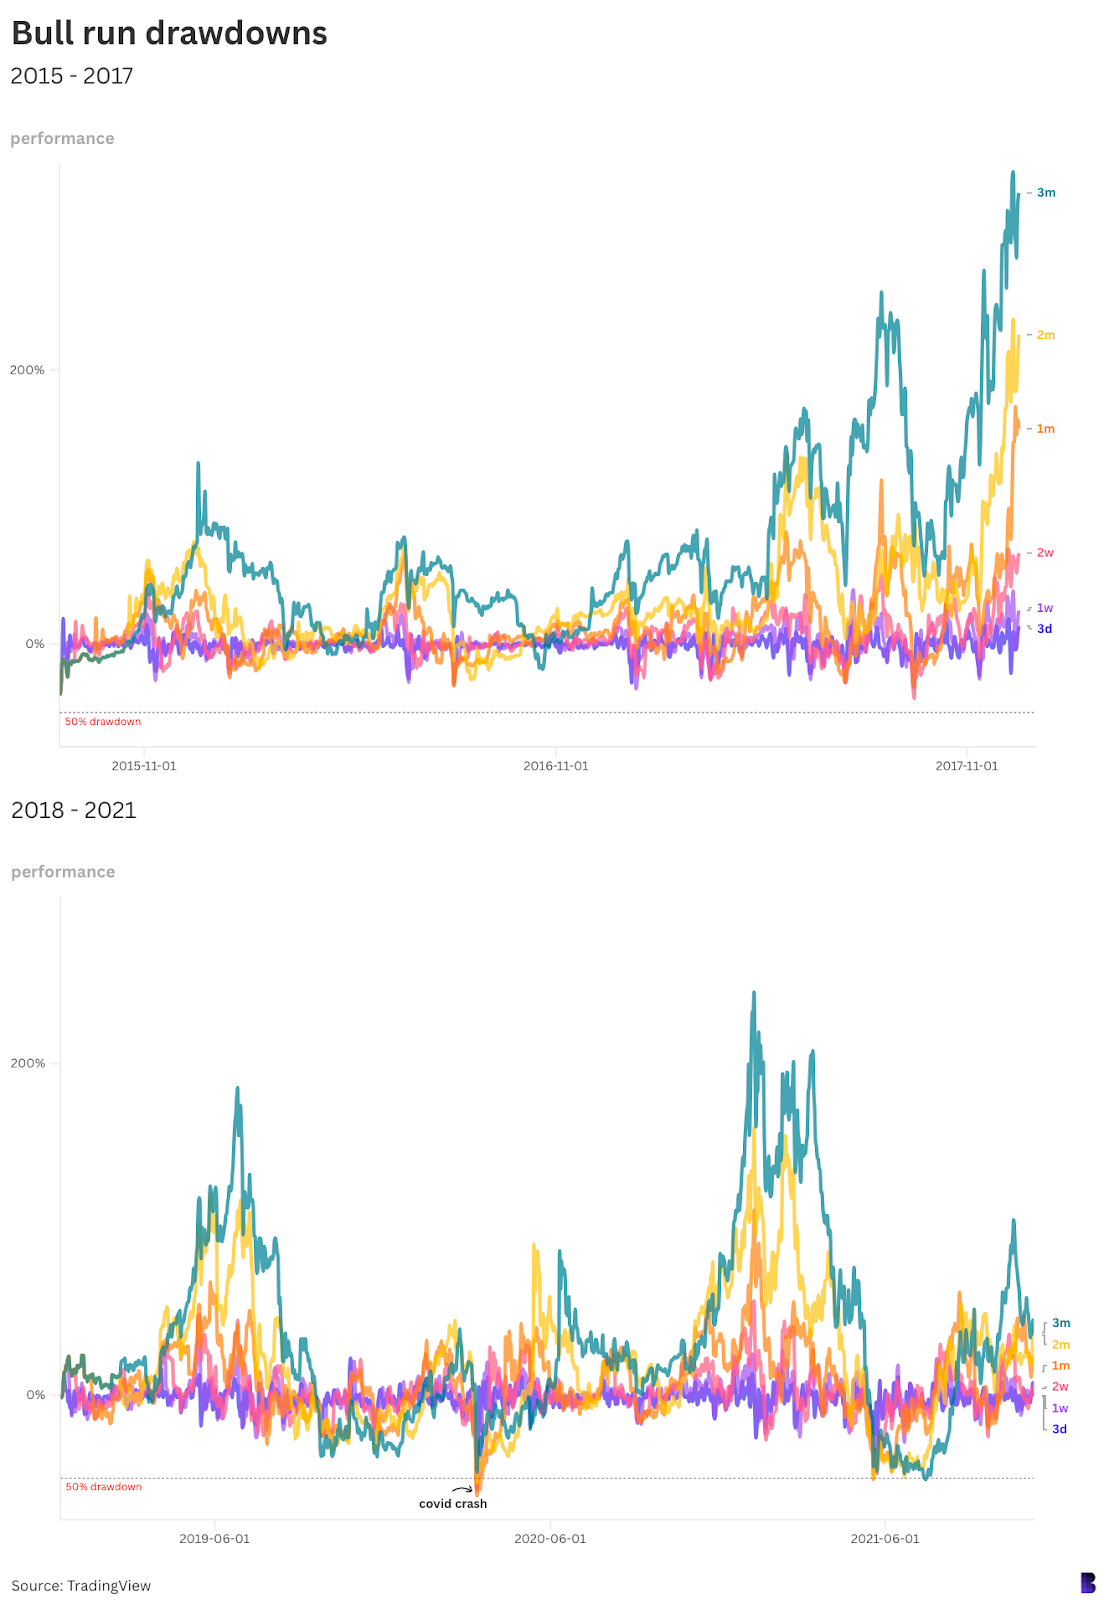
The dotted line indicates a hypothetical 50% drawdown. Notably, during the bull run from August 2015 to December 2017, the largest retracement was 40% over two weeks. In contrast, the bull market from 2018 to 2021 saw three corrections exceeding 50%, including a major drop during the COVID-19 crash in March 2020, where Bitcoin fell by half or more across most timeframes.
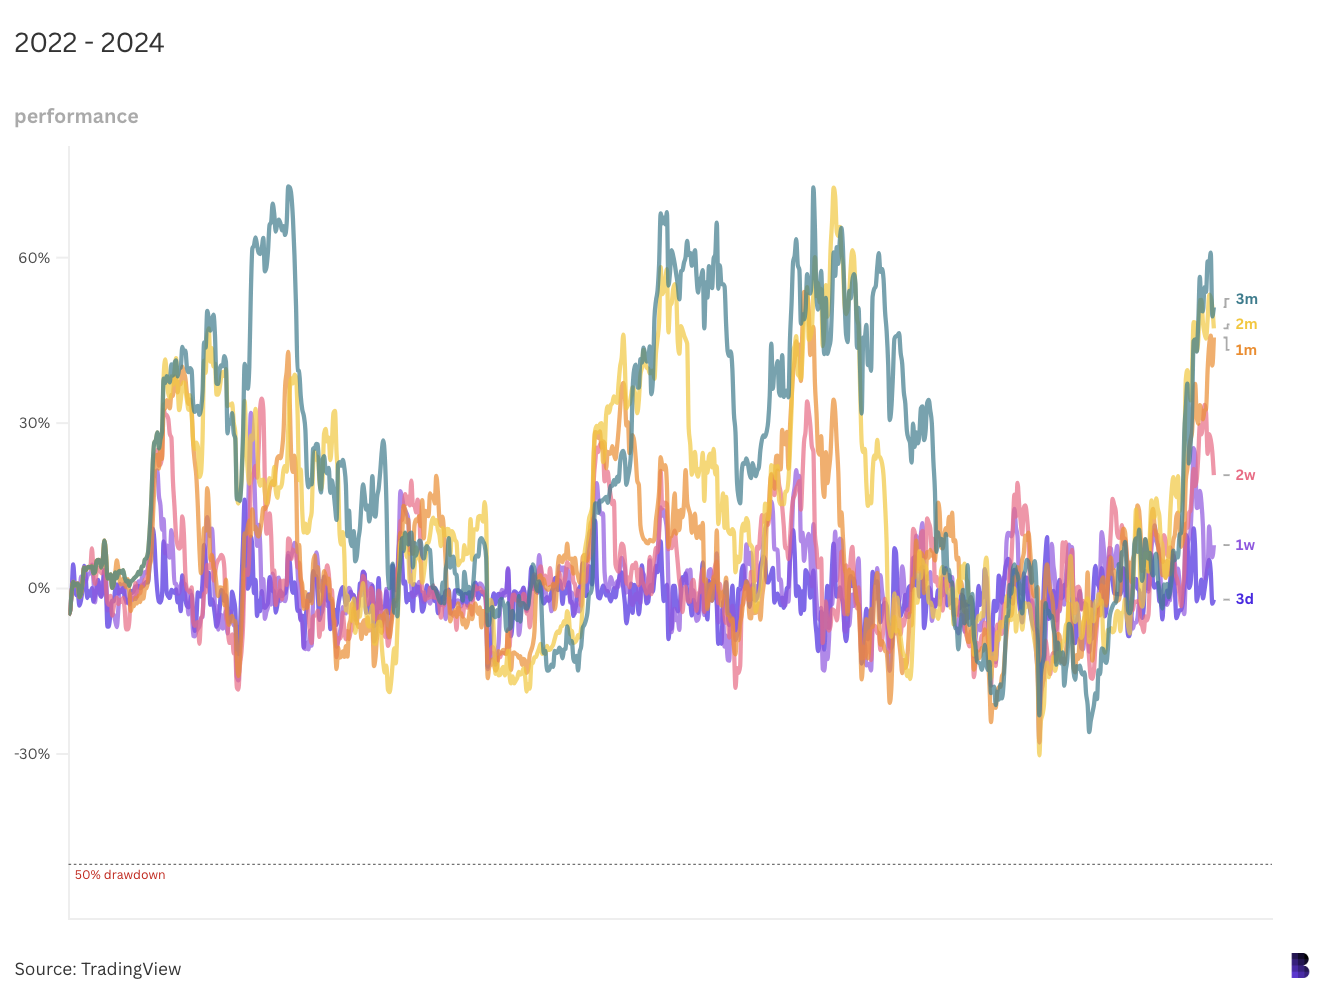
In the current cycle, the worst mid-bull correction occurred in early August, with a decline of 30% from over $70,000 to $49,200.
Despite Bitcoin's historical volatility, significant drawdowns typically happen towards the end of bull runs. The absence of such corrections may indicate increased risk as the cycle progresses.