9 0
Bitcoin Faces Potential Drop to $100K After Trendline Resistance Rejection
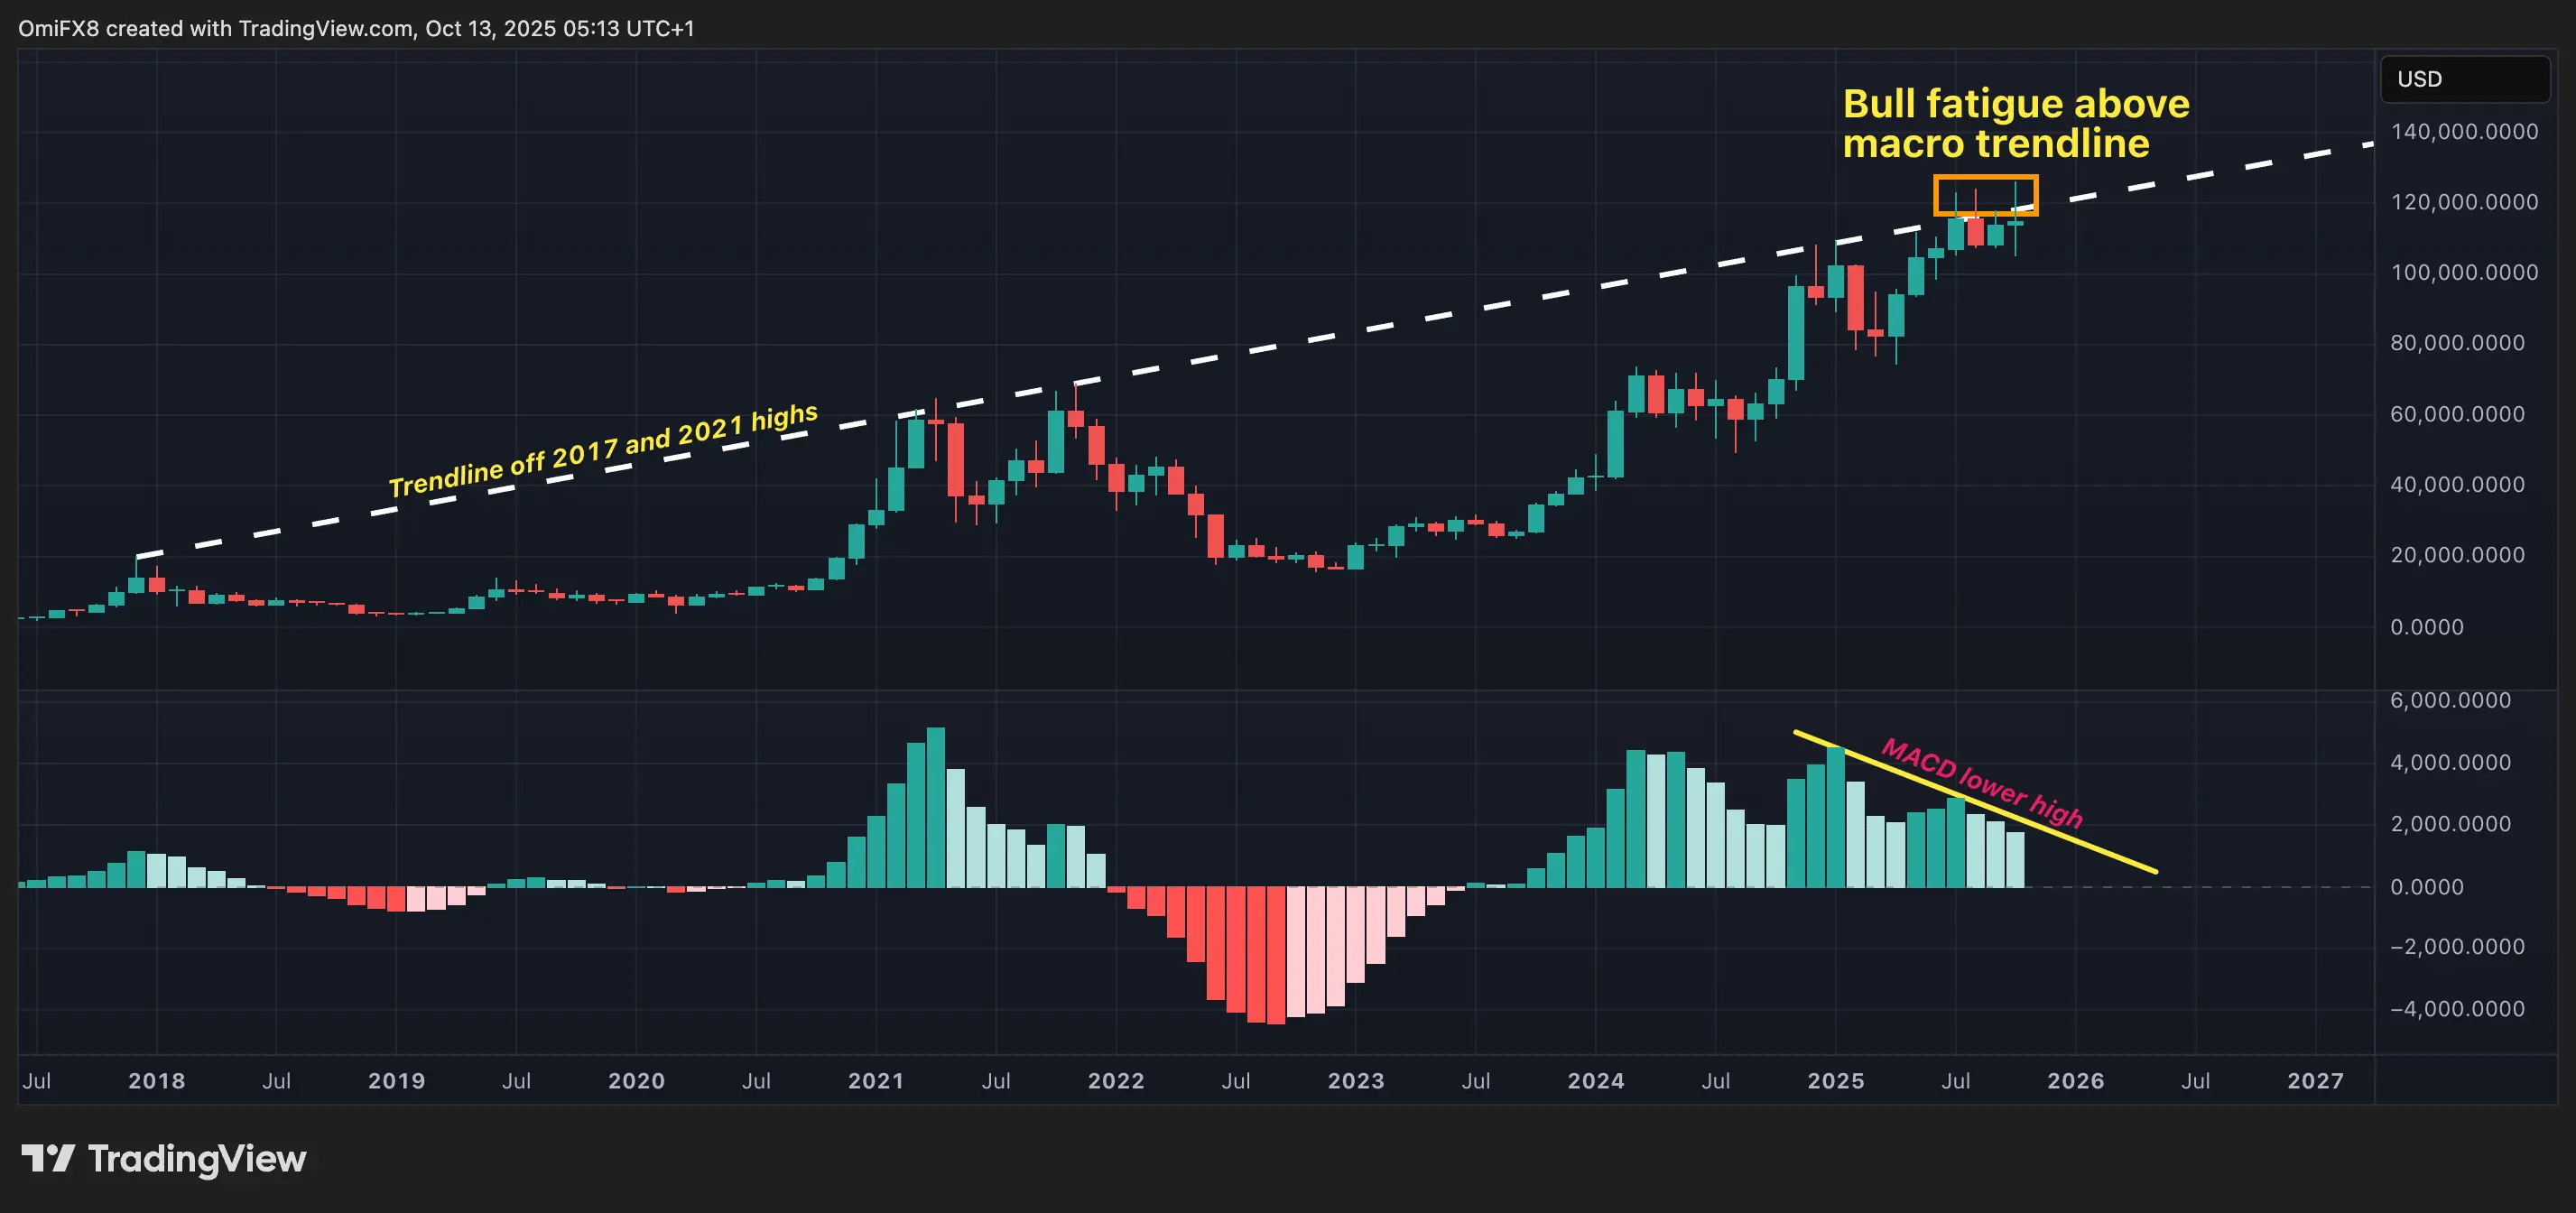
The recent analysis by CoinDesk's Omkar Godbole highlights a pattern in the BTC market, where bulls have failed three times to maintain gains above a critical trendline from the 2017 and 2021 highs. This trendline has become a significant resistance point, indicating limitations in bullish strength.
- The trendline resistance and long wicks on July, August, and October candles suggest bull fatigue above this level.
- The MACD histogram on the monthly chart shows weakening upward momentum compared to the December-January rally when BTC first surpassed $100,000.
- The daily chart indicates a bearish reversal from the expanding channel resistance, with negative readings in both standard and longer-term MACD histograms suggesting downward pressure.
- The path of least resistance appears downward, with potential for a drop below $100,000, testing the lower end of the expanding triangle.
- Support might be found at the 200-day simple moving average around $107,000.
- Bulls need to break above $121,800 to reverse the bearish trend, with current trading at $114,800.

Overall, the analysis suggests caution as the trendline continues to act as a formidable resistance, potentially leading to further declines if not breached.