Sep 25, 2025
10 1
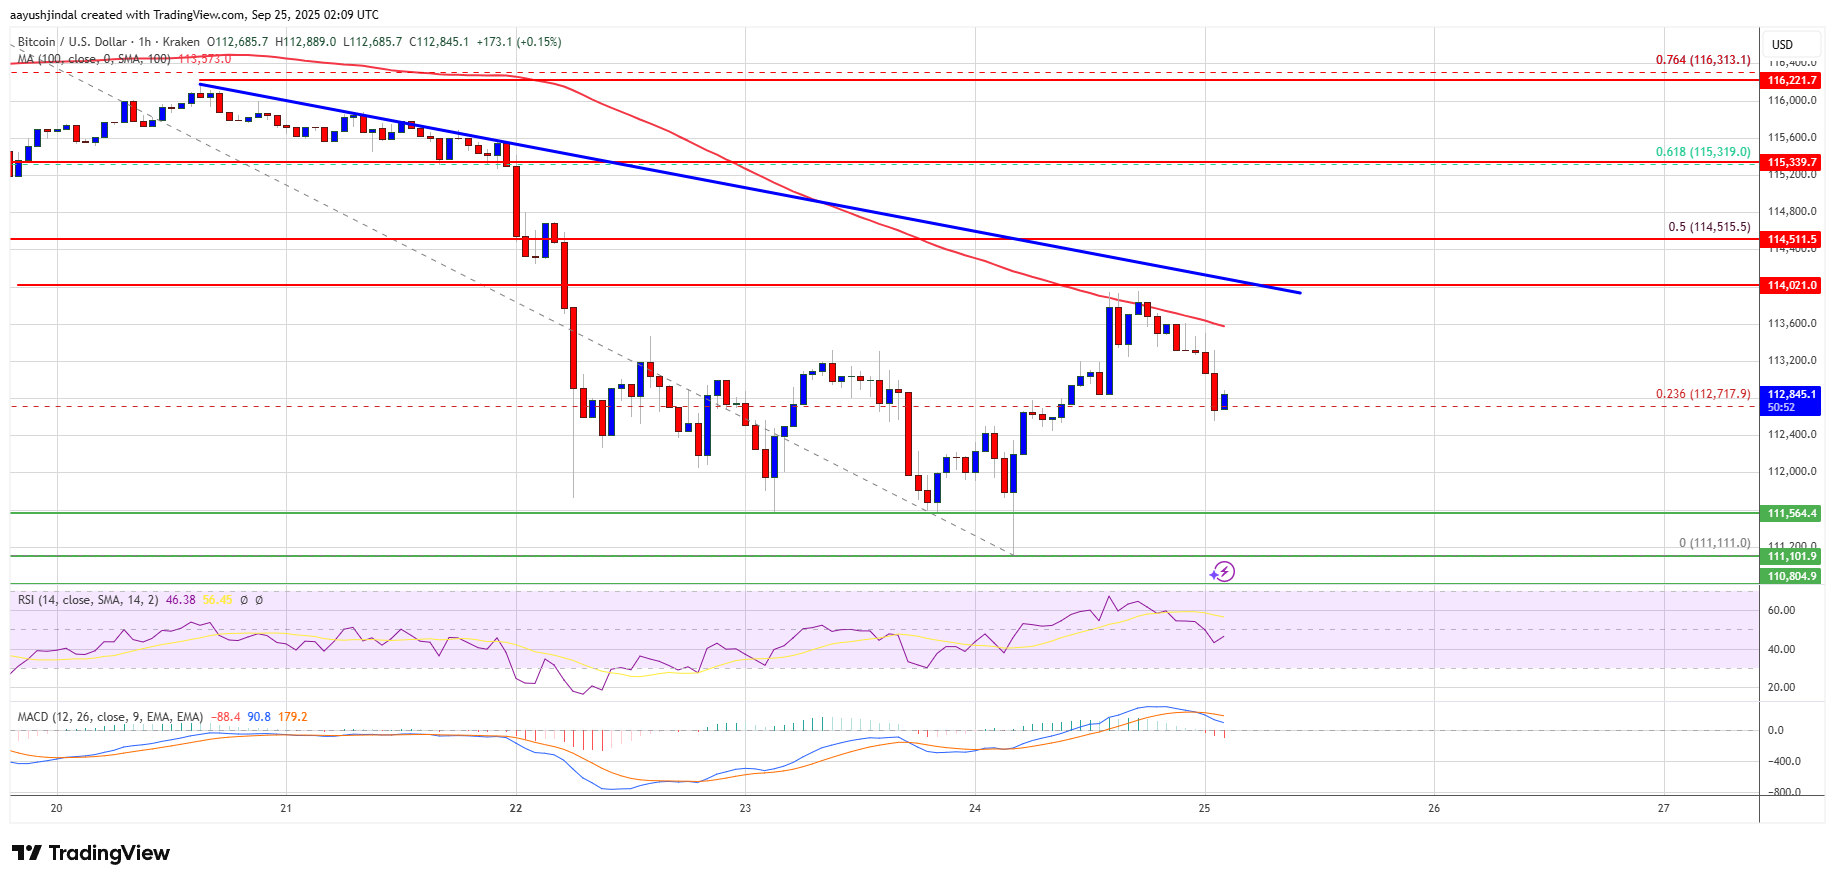
Bitcoin Price Drops Below $113,500 Amid Bearish Trend
Bitcoin Price Analysis:
- Bitcoin (BTC) has extended losses, trading below $113,800 and currently consolidating.
- The price is below the $113,500 zone and the 100-hourly simple moving average.
- A bearish trend line is forming with resistance at $114,000 on the BTC/USD hourly chart.
- If BTC clears the $114,000 zone, it might start another increase.
Resistance and Support Levels
- Immediate resistance is near $113,500, with key resistance at $114,000.
- Further resistance levels are $114,500 and potentially $115,500 if a breakout occurs.
- Immediate support is around $112,000, with major support at $111,250 and $110,500.
- If BTC moves below $107,500, more bearish momentum could develop.
Technical Indicators
- Hourly MACD: Gaining pace in the bearish zone.
- Hourly RSI: Below the 50 level for BTC/USD.
Investors should monitor these levels for potential price movements in Bitcoin.