Jan 20, 2026
1 0
Bitcoin Drops Below $93,000, Risks Further Decline
Bitcoin Price Update
- Bitcoin experienced a decline below $94,000 and $93,000.
- The current price remains under $93,000 and is below the 100 hourly Simple Moving Average.
- A bearish trend line with resistance at $94,600 is forming on the hourly BTC/USD chart.
- BTC faces potential further declines if it stays below $94,000.
After failing to hold above $93,500, Bitcoin dropped sharply past $93,000 and $92,500, hitting a low of $91,866. A minor recovery was noted above the 23.6% Fib retracement level from the recent drop.
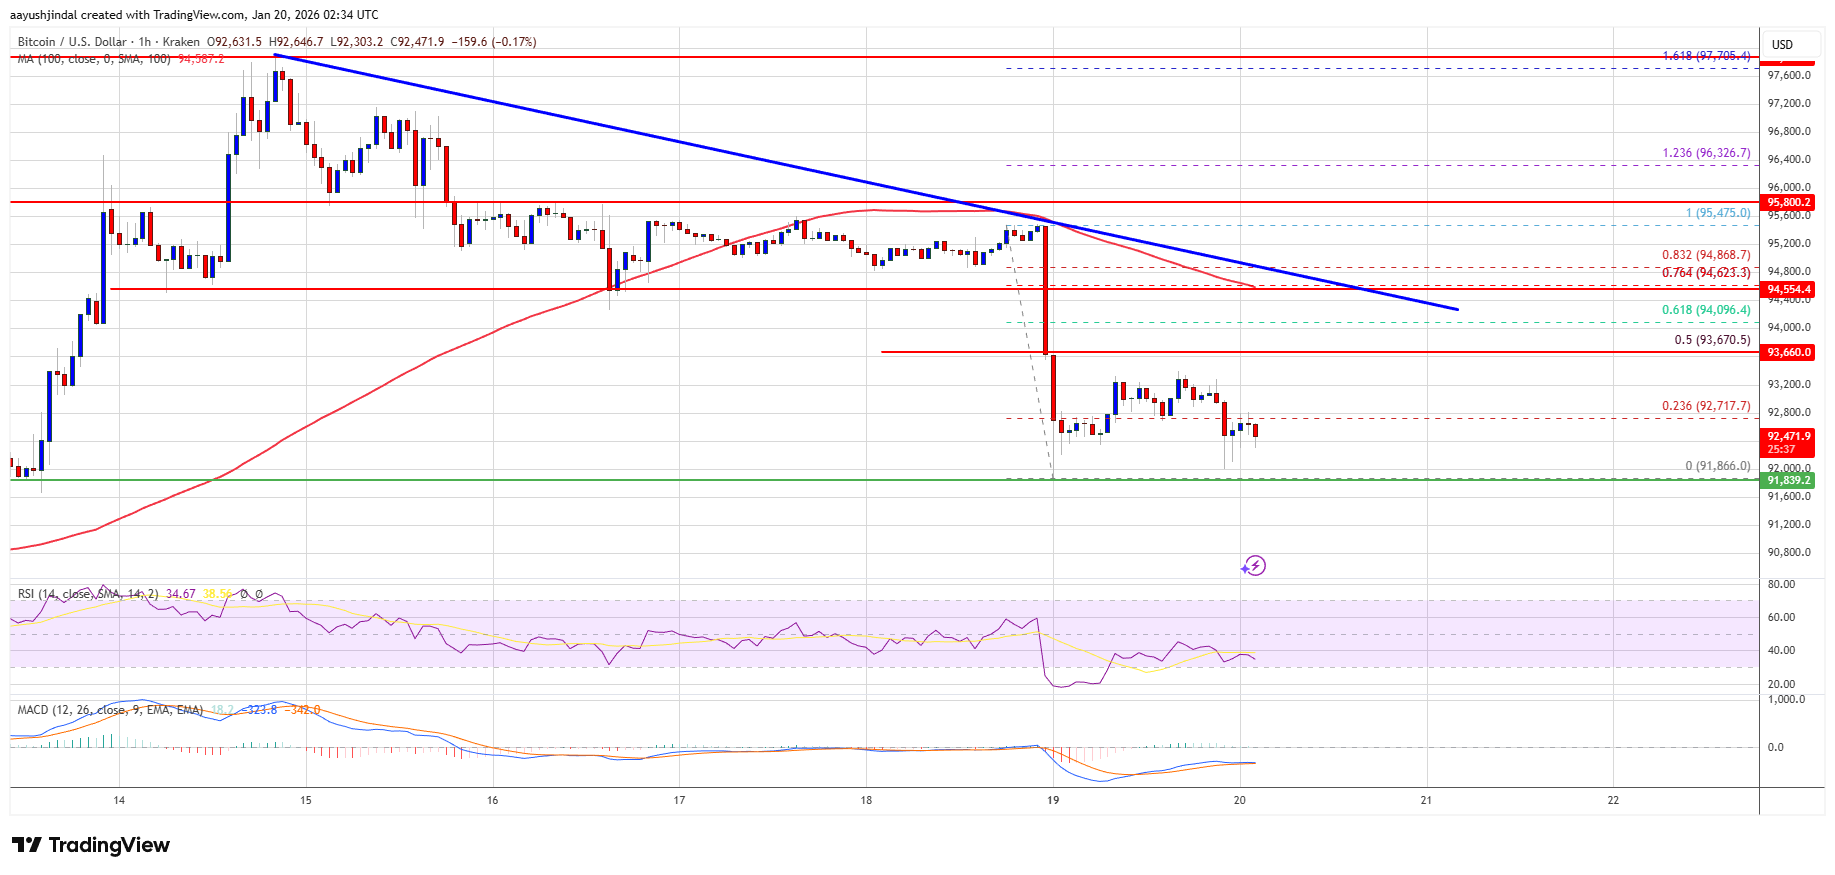
Resistance levels are set at $92,800 and $93,200. Overcoming these could push the price to $93,650, aligning with the 50% Fib retracement level.
Potential Downside for BTC
- If unable to break $93,650 resistance, BTC may decline again.
- Key support is around $92,000 and $91,800, with further supports near $91,200 and $90,500.
- Main support rests at $90,000; a breach could lead to accelerated declines.
Technical Indicators
- Hourly MACD: Increasing in the bearish zone.
- Hourly RSI: Below 50.
Support Levels: $92,000 and $91,800
Resistance Levels: $93,650 and $94,000