Apr 29, 2025
2 0
Bitcoin Price Prints Rare Golden Cross, Signaling Potential Bullish Rally
Bitcoin has formed a rare Golden Cross on its weekly chart, a technical signal historically associated with significant price increases. This pattern occurs when the 50-week Moving Average crosses above the 200-week Moving Average.
Key Highlights
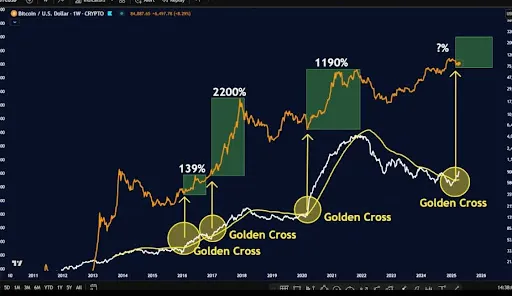
- This Golden Cross has been observed three times in the last decade, each leading to substantial price surges.
- In 2016, Bitcoin rose by 139% following the formation of this cross.
- During the 2017 bull market, Bitcoin experienced a 2,200% increase after a similar crossover.
- The 2020 Golden Cross preceded a rally of 1,190%, reaching an all-time high near $69,000.
- Currently, analysts suggest that Bitcoin could be preparing for another major rally.
Price Predictions
- Analysts expect Bitcoin may reach over $200,000 based on historical patterns.
- Crypto Caeser forecasts a potential new all-time high of around $110,000 in this cycle.
- A key support zone is identified at approximately $90,000, deemed optimal for buying.