Bitcoin Hits $104,088 Before Plummeting to $90,500 in Volatile Trading
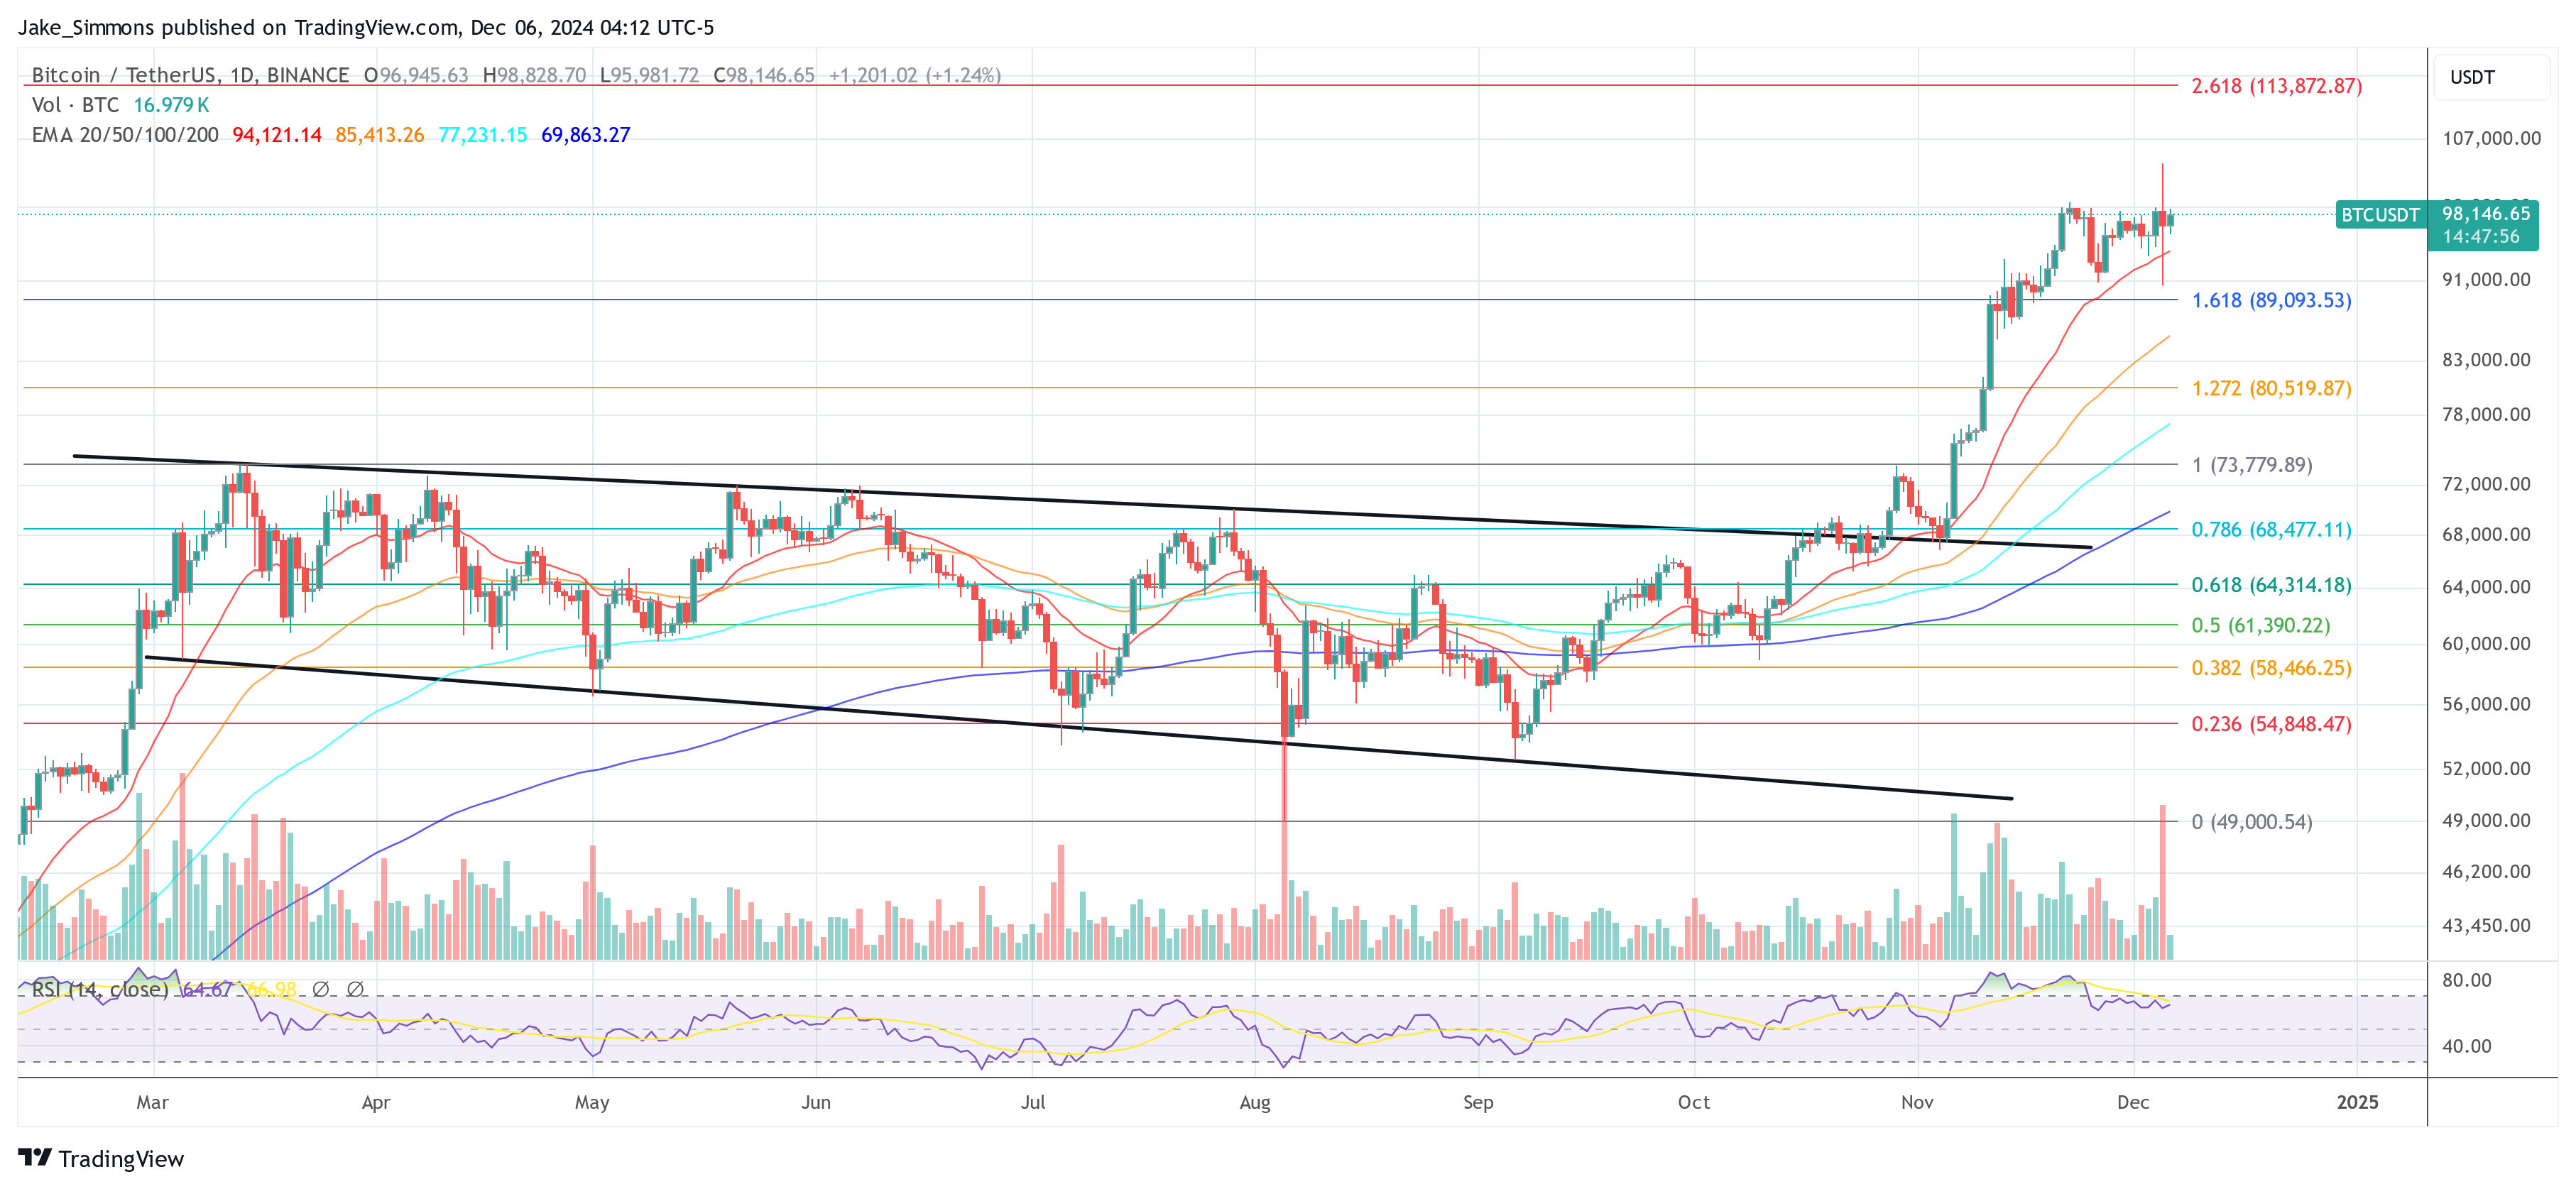
Bitcoin displayed significant volatility after achieving a new all-time high of $104,088. Following this peak, BTC dropped from $103,550 to a low of $90,500 before stabilizing. Analysts suggest this may indicate a routine market flush-out rather than a cyclical peak.
Could This Be The Bitcoin Cycle Top?
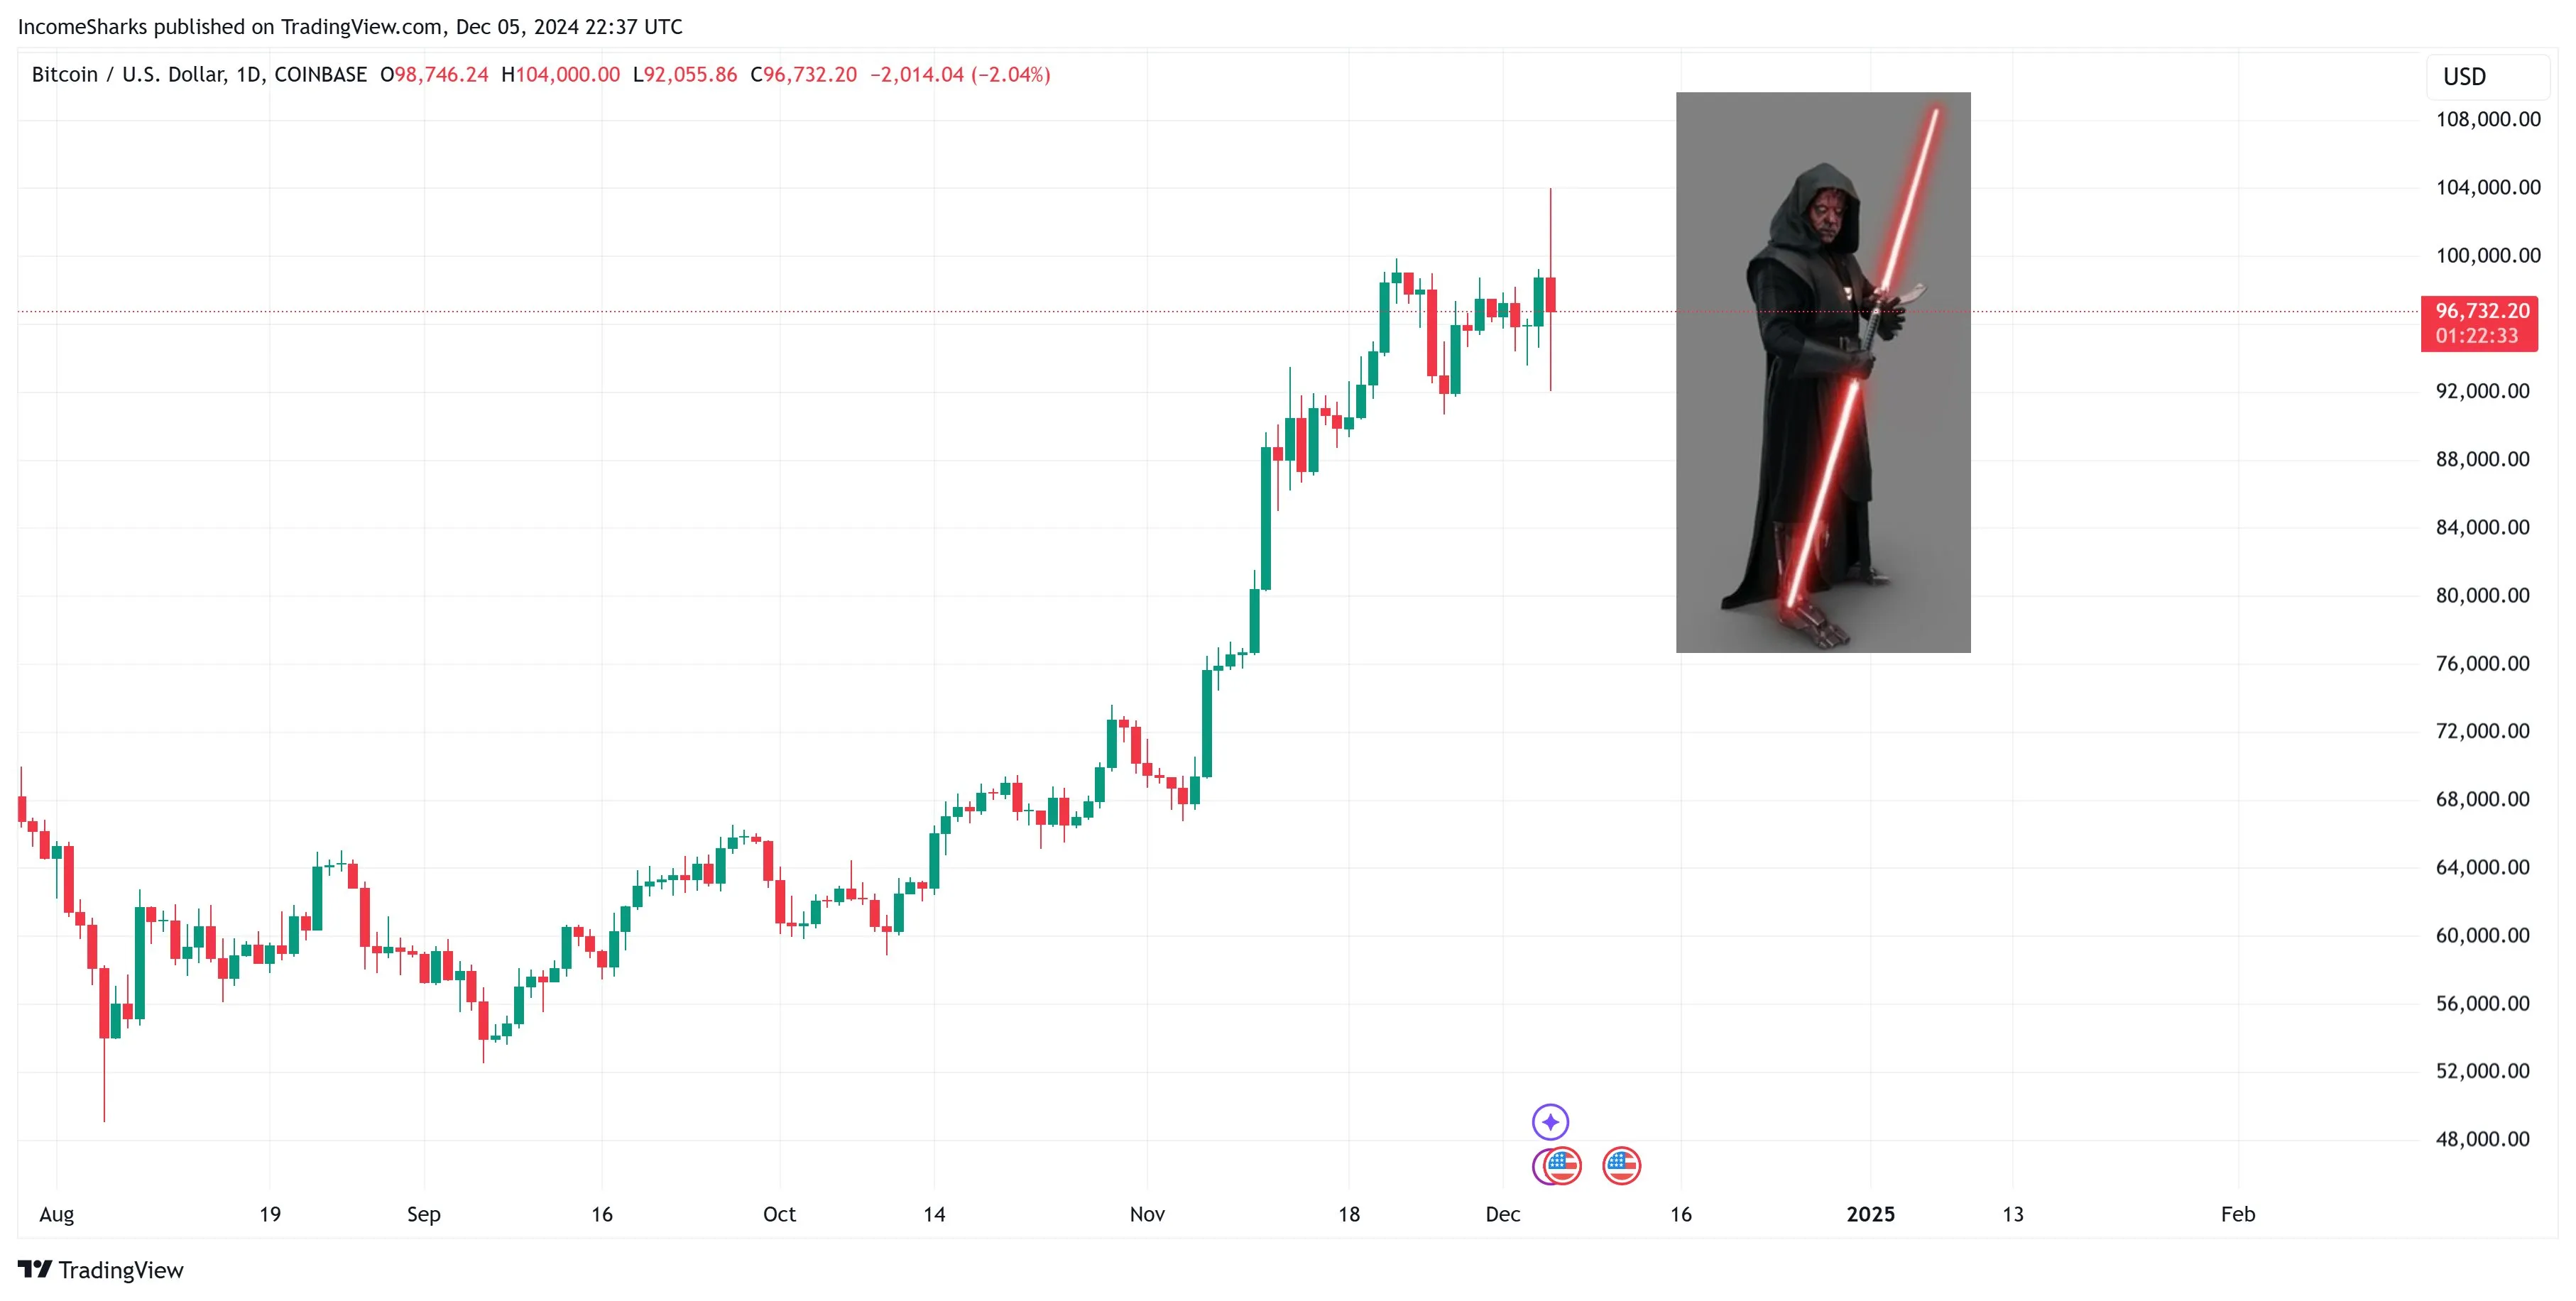
Traders on X believe that the rapid price movement was influenced by large players acting against high-leverage traders. Veteran trader IncomeSharks noted that such a “Darth Maul” candle pattern typically indicates market manipulation aimed at punishing late long positions and trapping short sellers.
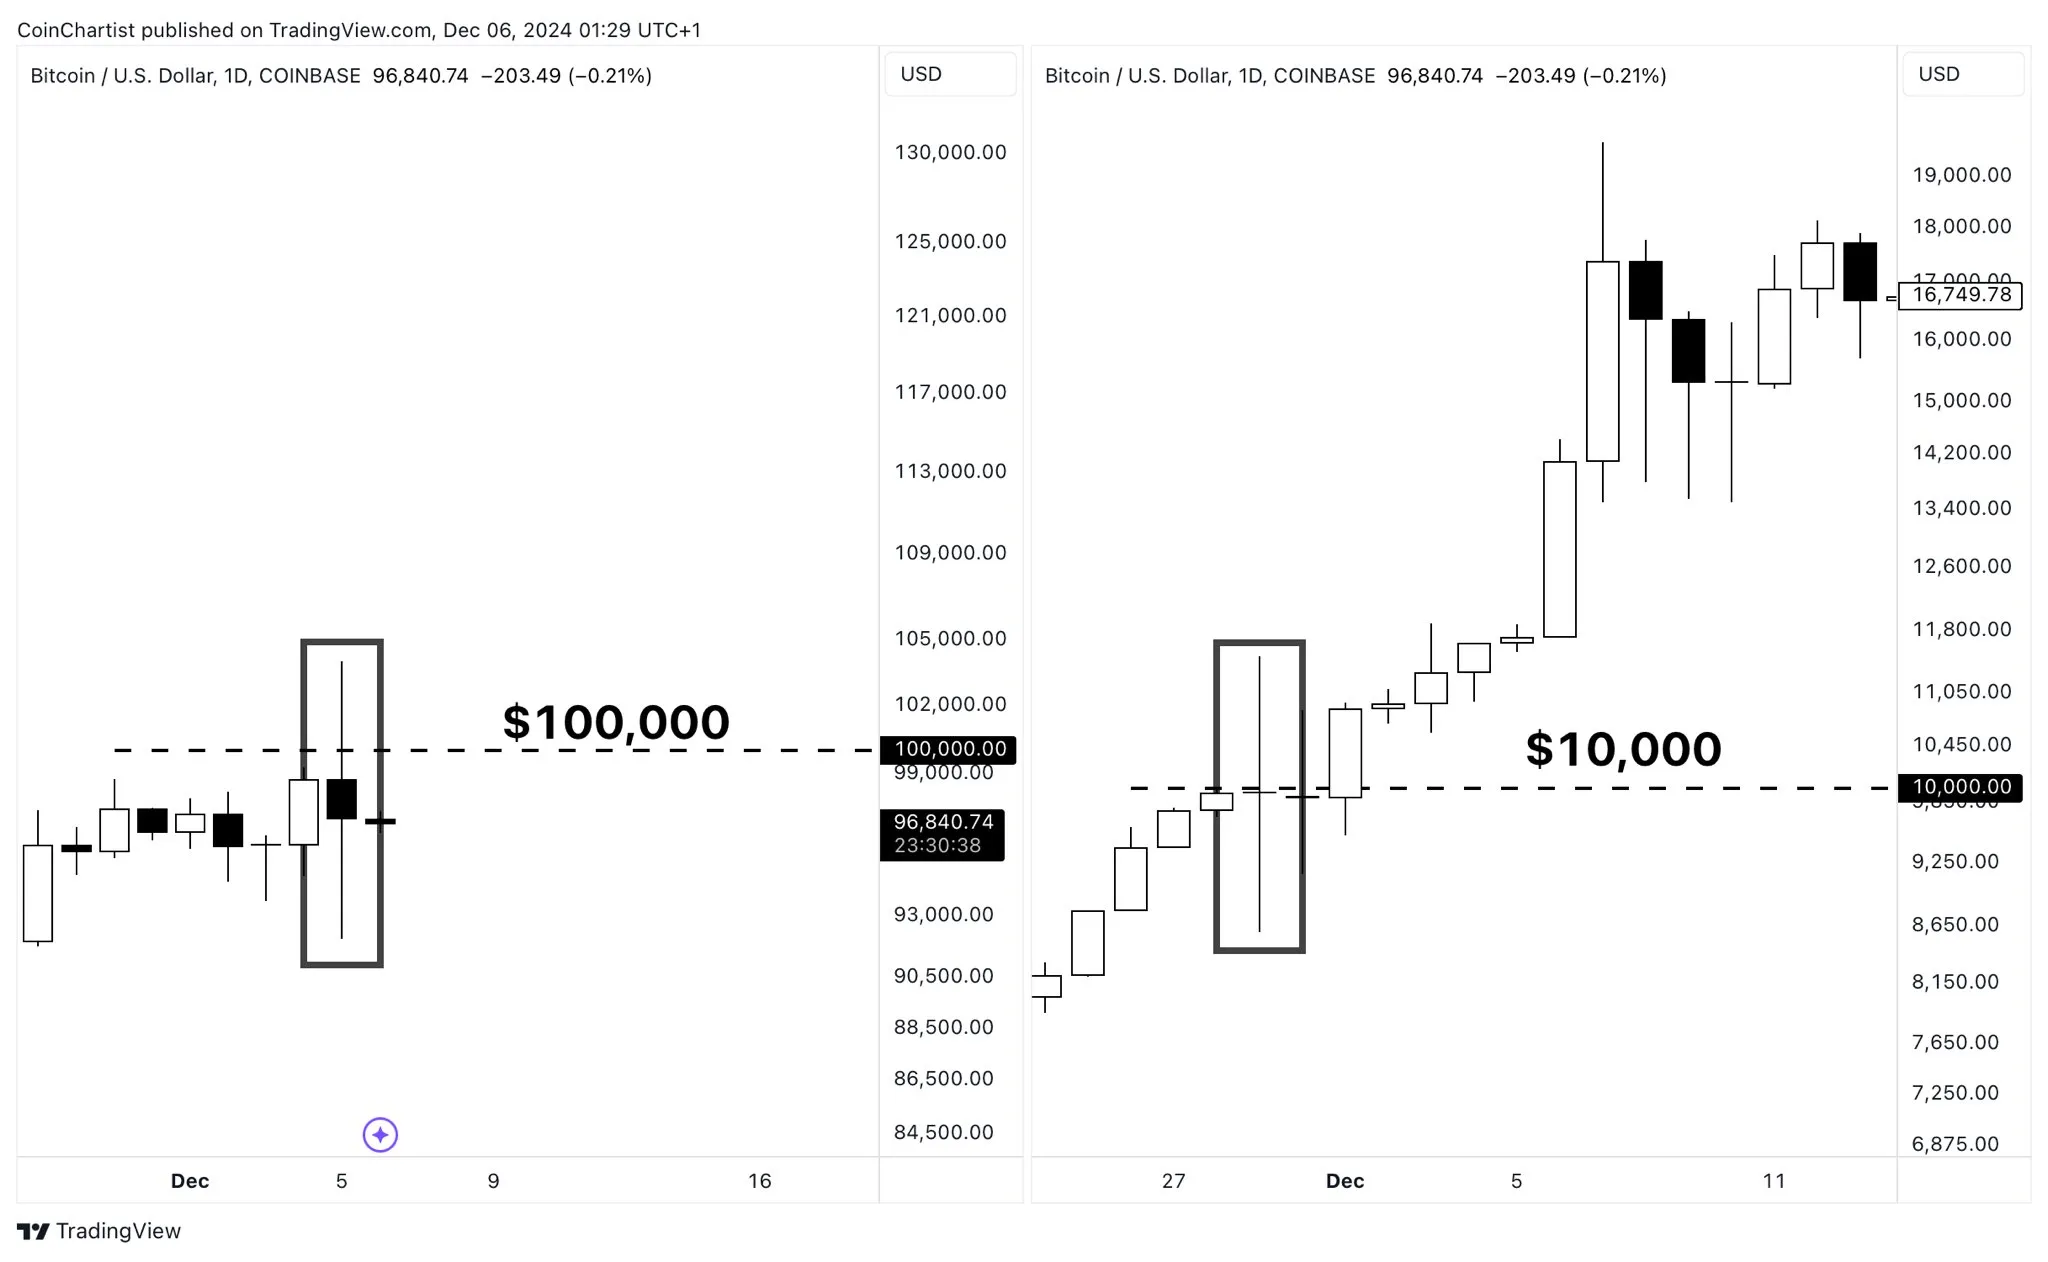
Analyst Astronomer remarked that this behavior is common among whales manipulating leverage in the market. Tony Severino highlighted the extreme volatility, emphasizing that $10,000 price swings are now typical for Bitcoin trading around $100,000.
Severino compared current conditions to those during previous bull runs, indicating that $100K Bitcoin equates to past levels of $10K.
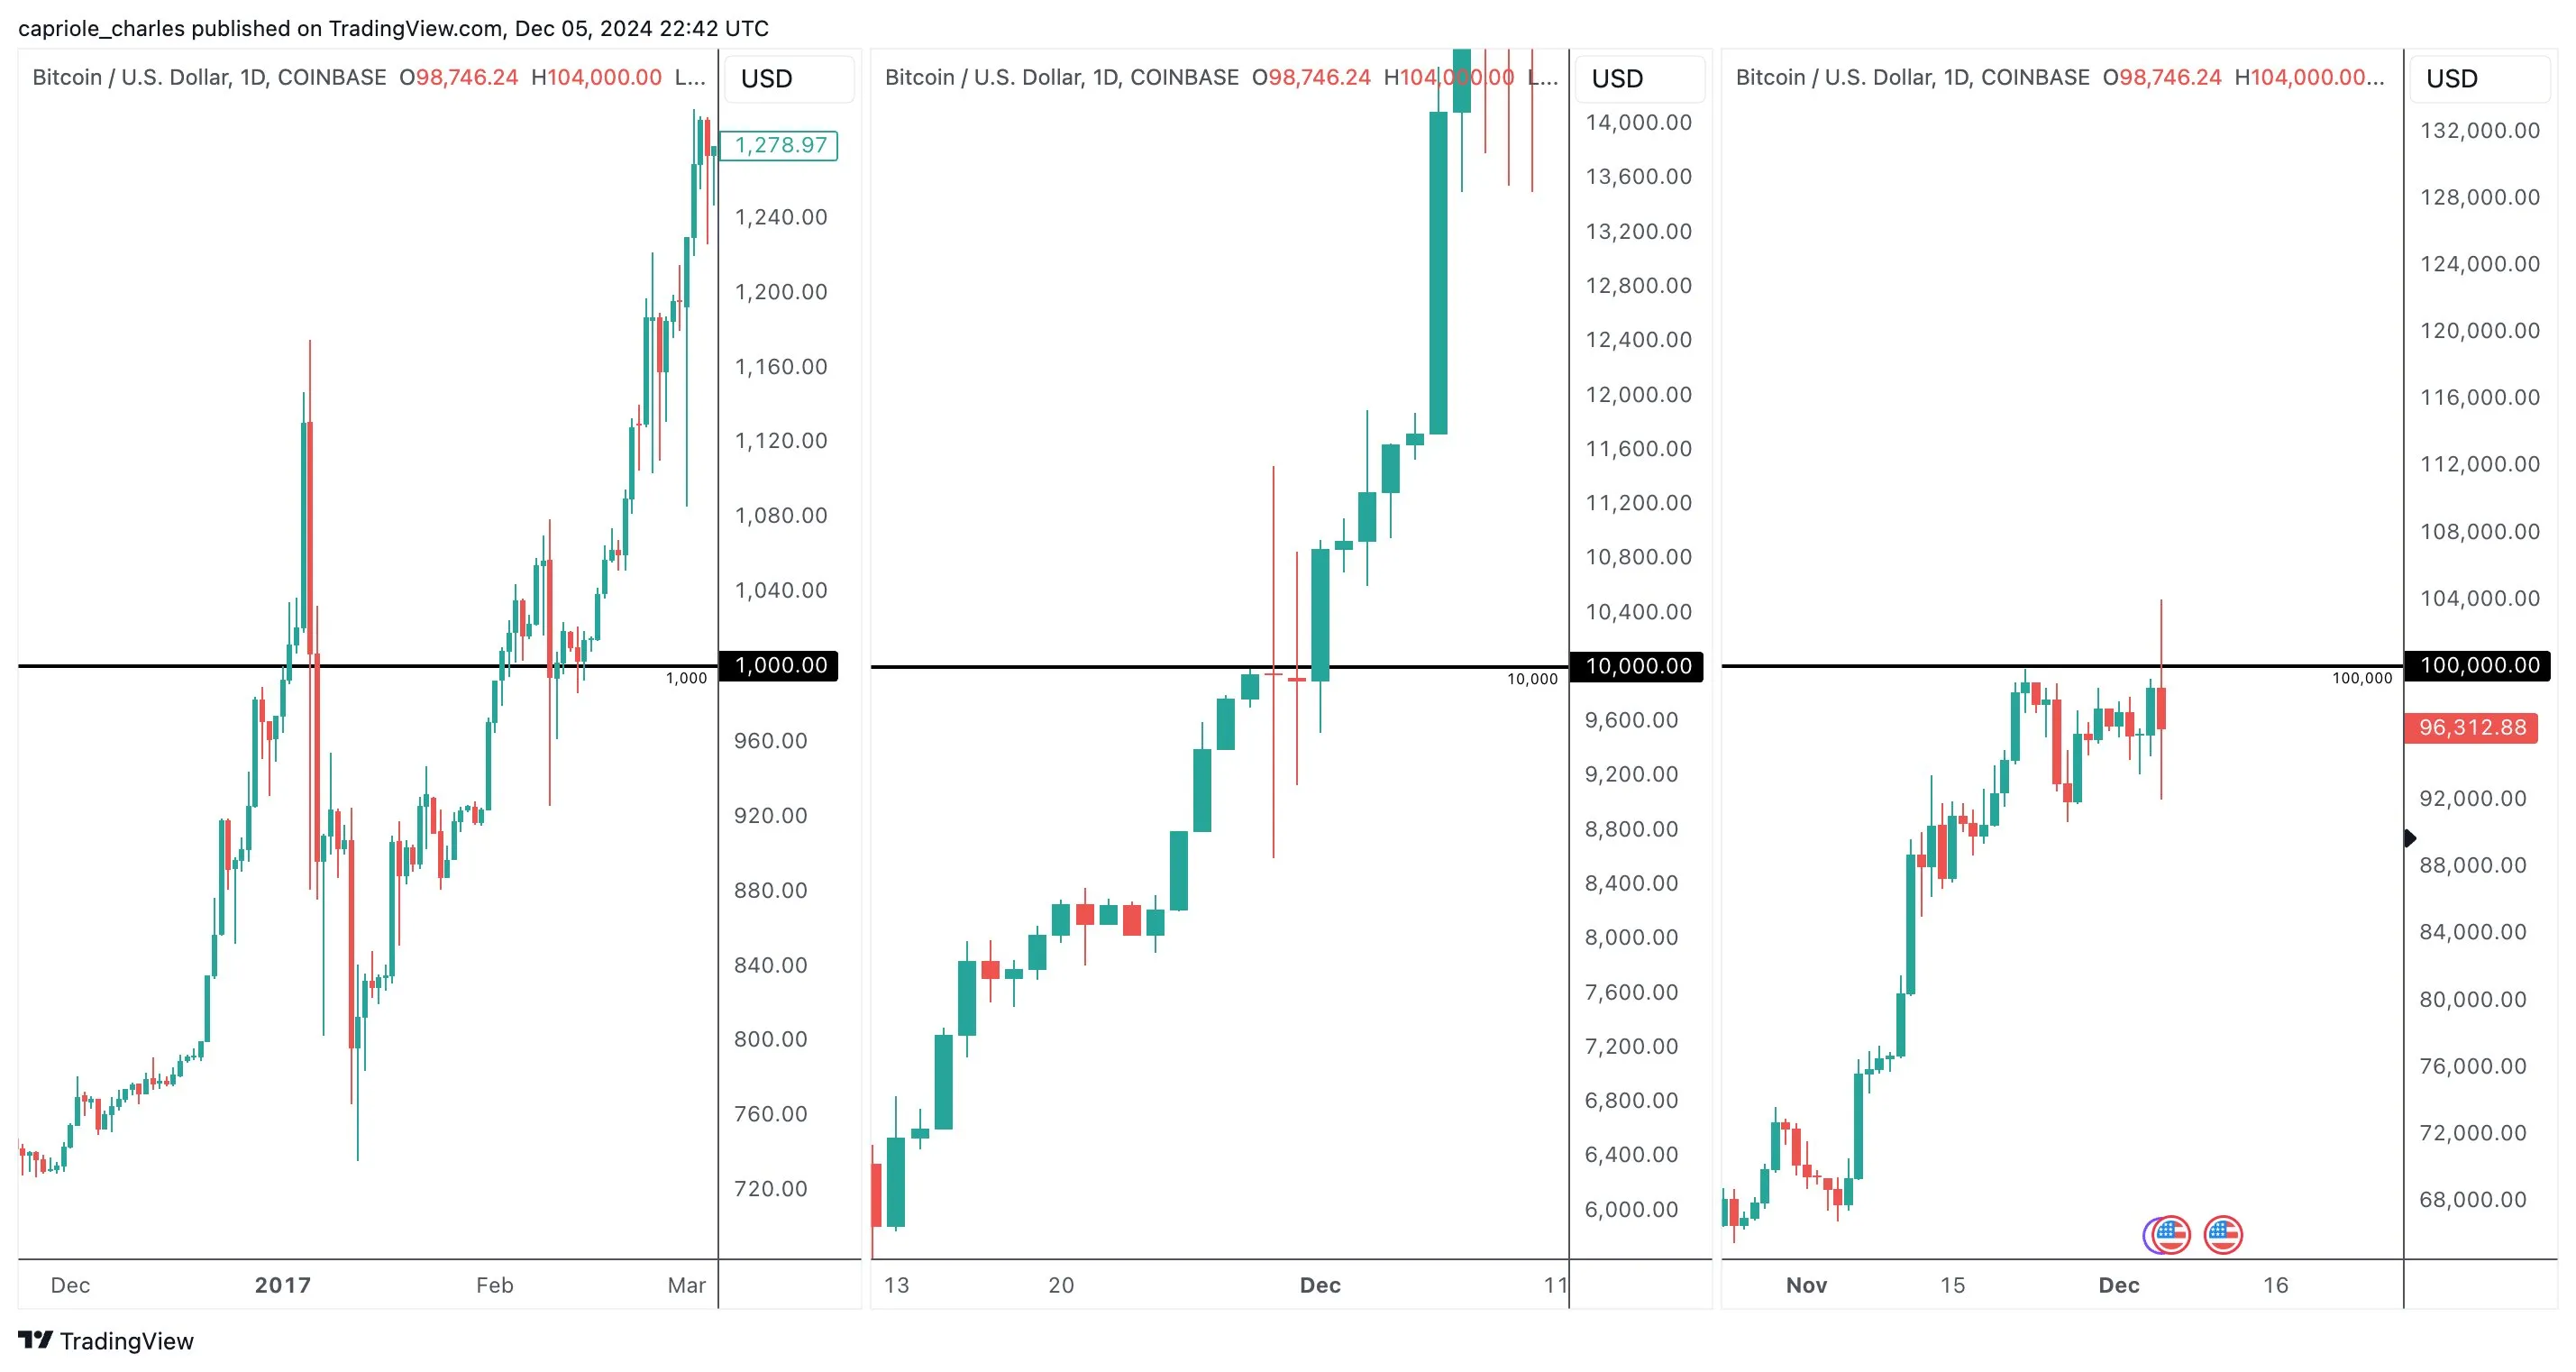
Charles Edwards provided historical context, noting similar volatility when Bitcoin traded at lower price points, reinforcing that such fluctuations are normal.
Key indicators suggest potential for further price increases. Matthew Sigel from VanEck pointed out that very few top signals indicate a market peak, asserting that the path of least resistance remains upward. He referenced metrics like the MVRV Z-Score, Bitcoin Price SMA Multiplier, subdued Google Trends, and Crypto Market Dominance as supportive of ongoing growth.
Macro analyst Alex Krüger expressed that the recent price drop does not signify the end of the bull run, citing strong fundamentals behind Bitcoin's rally. He noted shifts in retail interest towards older altcoins but maintained that Bitcoin’s underlying strength remains unchanged. As of this report, BTC is priced at $98,146.