May 21, 2025
2 0
Bitcoin Momentum May Be Stalling According to Technical Analysis Charts
Analyst Ali Martinez shared insights on Bitcoin's potential for reaching a new all-time high (ATH) based on technical analysis (TA) indicators.
Key Technical Indicators for Bitcoin
- The first chart shows Bitcoin trading within a "Parallel Channel," suggesting consolidation between two parallel trendlines. BTC is near the upper line, where it has faced rejection in previous retests.
- The second chart indicates divergence in the Relative Strength Index (RSI). While Bitcoin’s price increased, the RSI formed a smaller peak, signaling potential bearishness.
- The third chart depicts a bearish crossover in the Moving Average Convergence/Divergence (MACD), with the MACD line dipping under the signal line, indicating weakening momentum.
Martinez suggests that current momentum for BTC may be stalling, and future developments will determine if a downward reversal occurs.
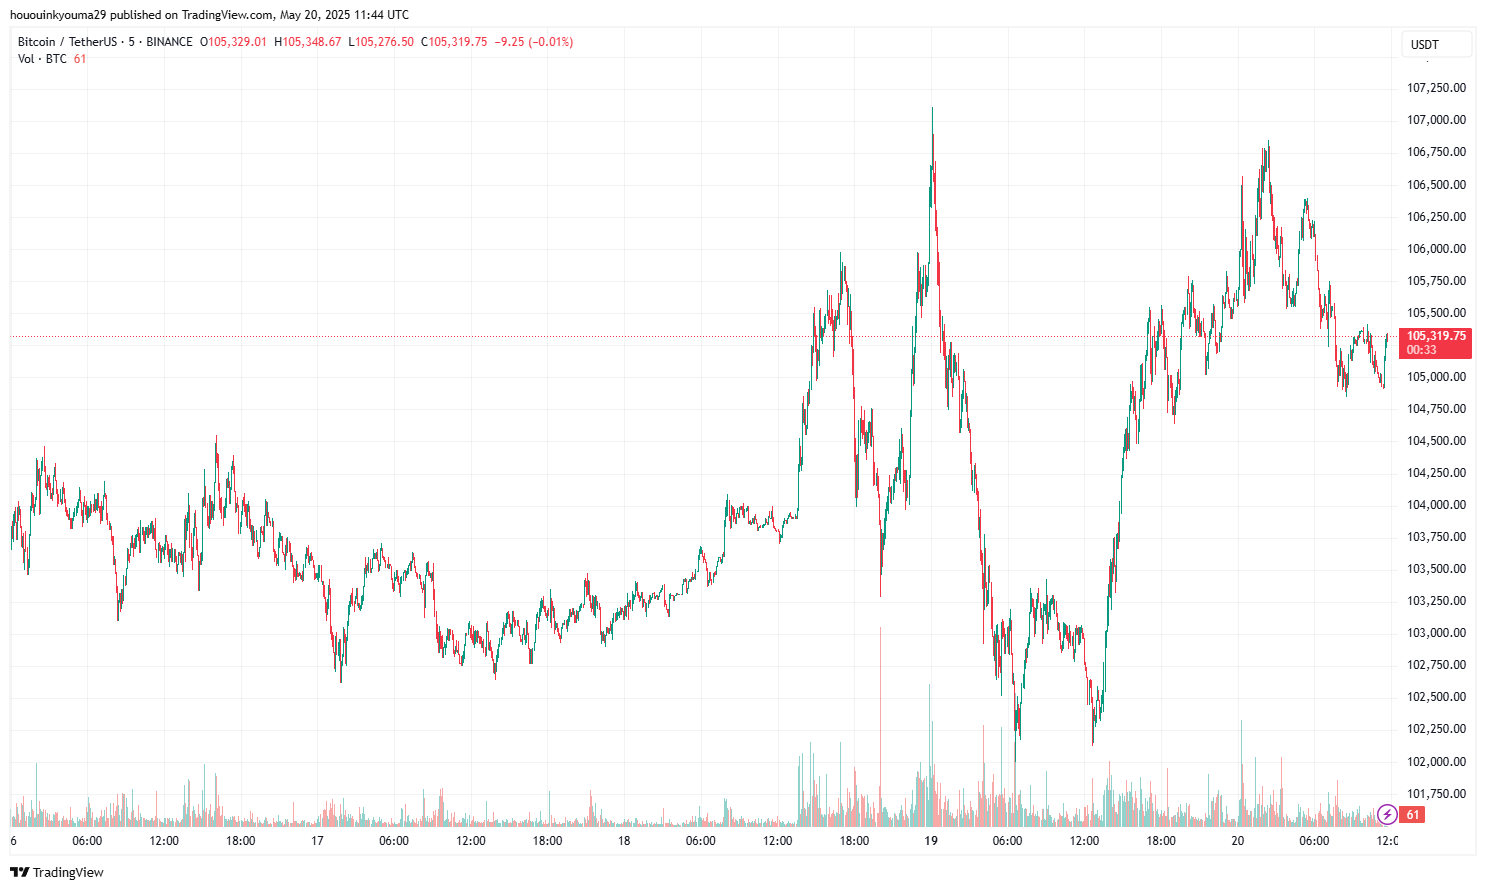
Current BTC Price
Bitcoin recently pulled back to $105,300 after attempting to break above $106,000.