Bitcoin MVRV Metric Indicates Bullish Market Sentiment
The ongoing Bitcoin bull market has led to increased interest in on-chain metrics to understand the underlying bullish trends.
Avocado Onchain, a CryptoQuant analyst, shared insights on Bitcoin’s market performance, focusing on the Market Value to Realized Value (MVRV) ratio. This indicator assesses Bitcoin's valuation relative to its realized cap, which reflects the aggregated value based on the last movement price of all Bitcoin.
Current Signals from the Bitcoin MVRV Metric
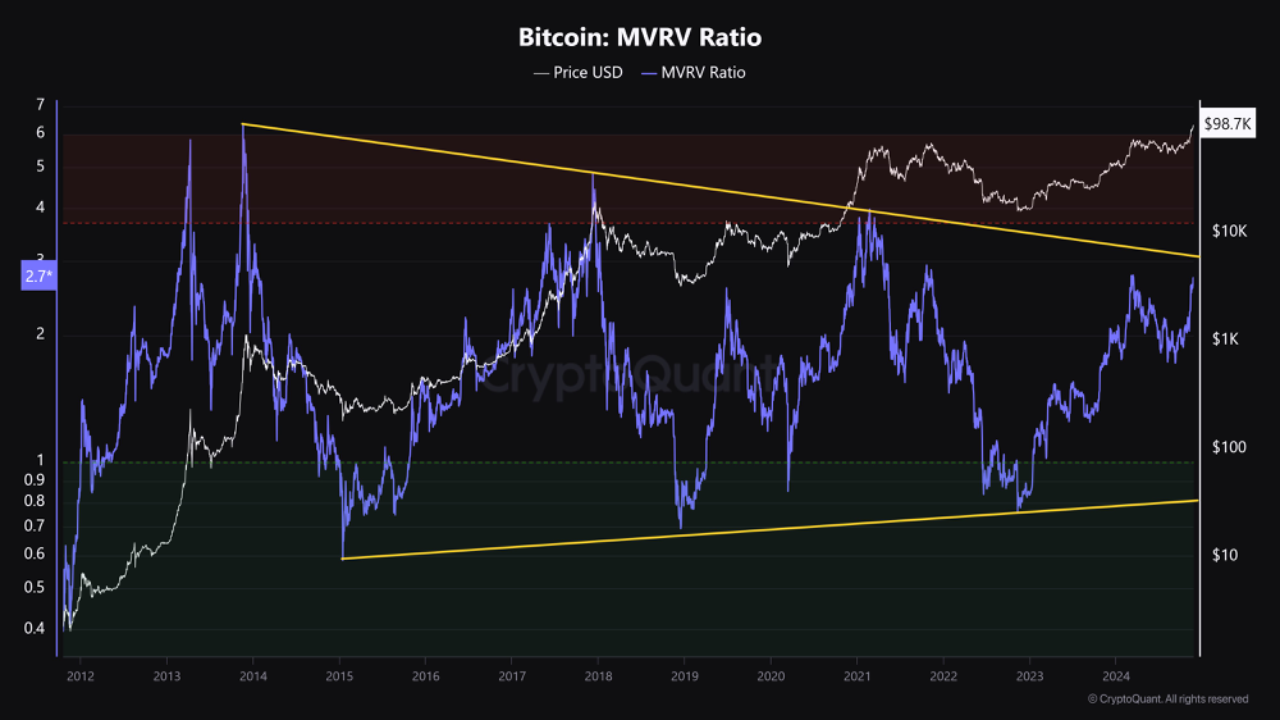
The MVRV ratio provides insights into market cycles. Historically, when the MVRV ratio dips below 1, it indicates a market bottom; values above 3.7 have coincided with potential market tops. As Bitcoin approaches new all-time highs, the MVRV ratio suggests a shift in market sentiment from skepticism to optimism, raising questions about investor interpretation of these metrics during a bull cycle.

The MVRV ratio, calculated by dividing Bitcoin’s market cap by its realized cap, indicates whether the asset is undervalued or overvalued relative to historical averages. Avocado Onchain noted that the ratio might not reach 3.7 this cycle but could still signal overvaluation at lower levels. The ratio’s peaks and troughs have shown a narrowing trend, with higher lows and lower highs.
MVRV Historical Patterns
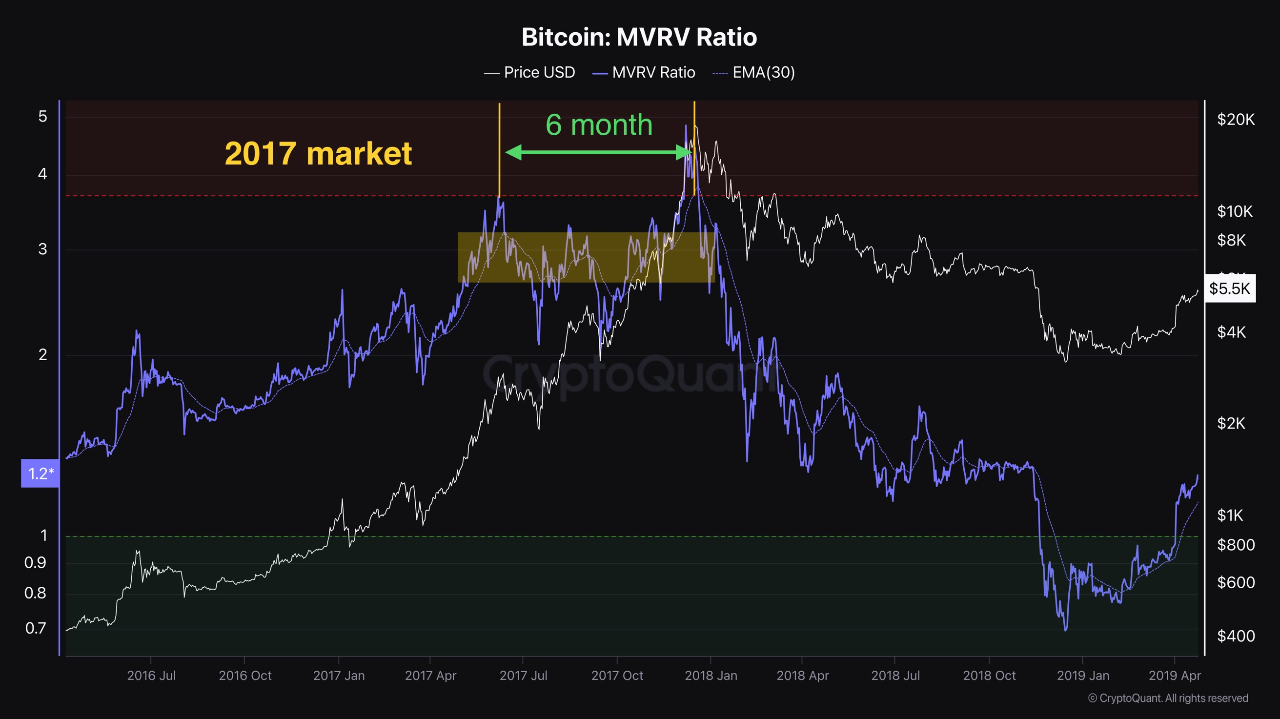
Historically, analysis shows that in 2017 the MVRV ratio first reached 3.7, but Bitcoin’s price peaked six months later. In 2021, the peak followed three months after the ratio hit 3.7.

While the MVRV ratio may signal overvaluation, it does not guarantee an imminent price peak. The ratio often remains in the overvaluation range, reflecting ongoing bullish sentiment amid price fluctuations.
To mitigate risks, Avocado Onchain advises against relying solely on the MVRV ratio for investment decisions. He recommends a gradual selling strategy as the ratio rises, allowing investors to balance potential gains with reduced exposure to market corrections. He concluded that asset prices often enter phases of extreme overvaluation that cannot be explained solely by numerical data. During a bull market, it is essential to consider on-chain metrics alongside factors like investor sentiment, macroeconomic trends, and government policies for a comprehensive analysis.

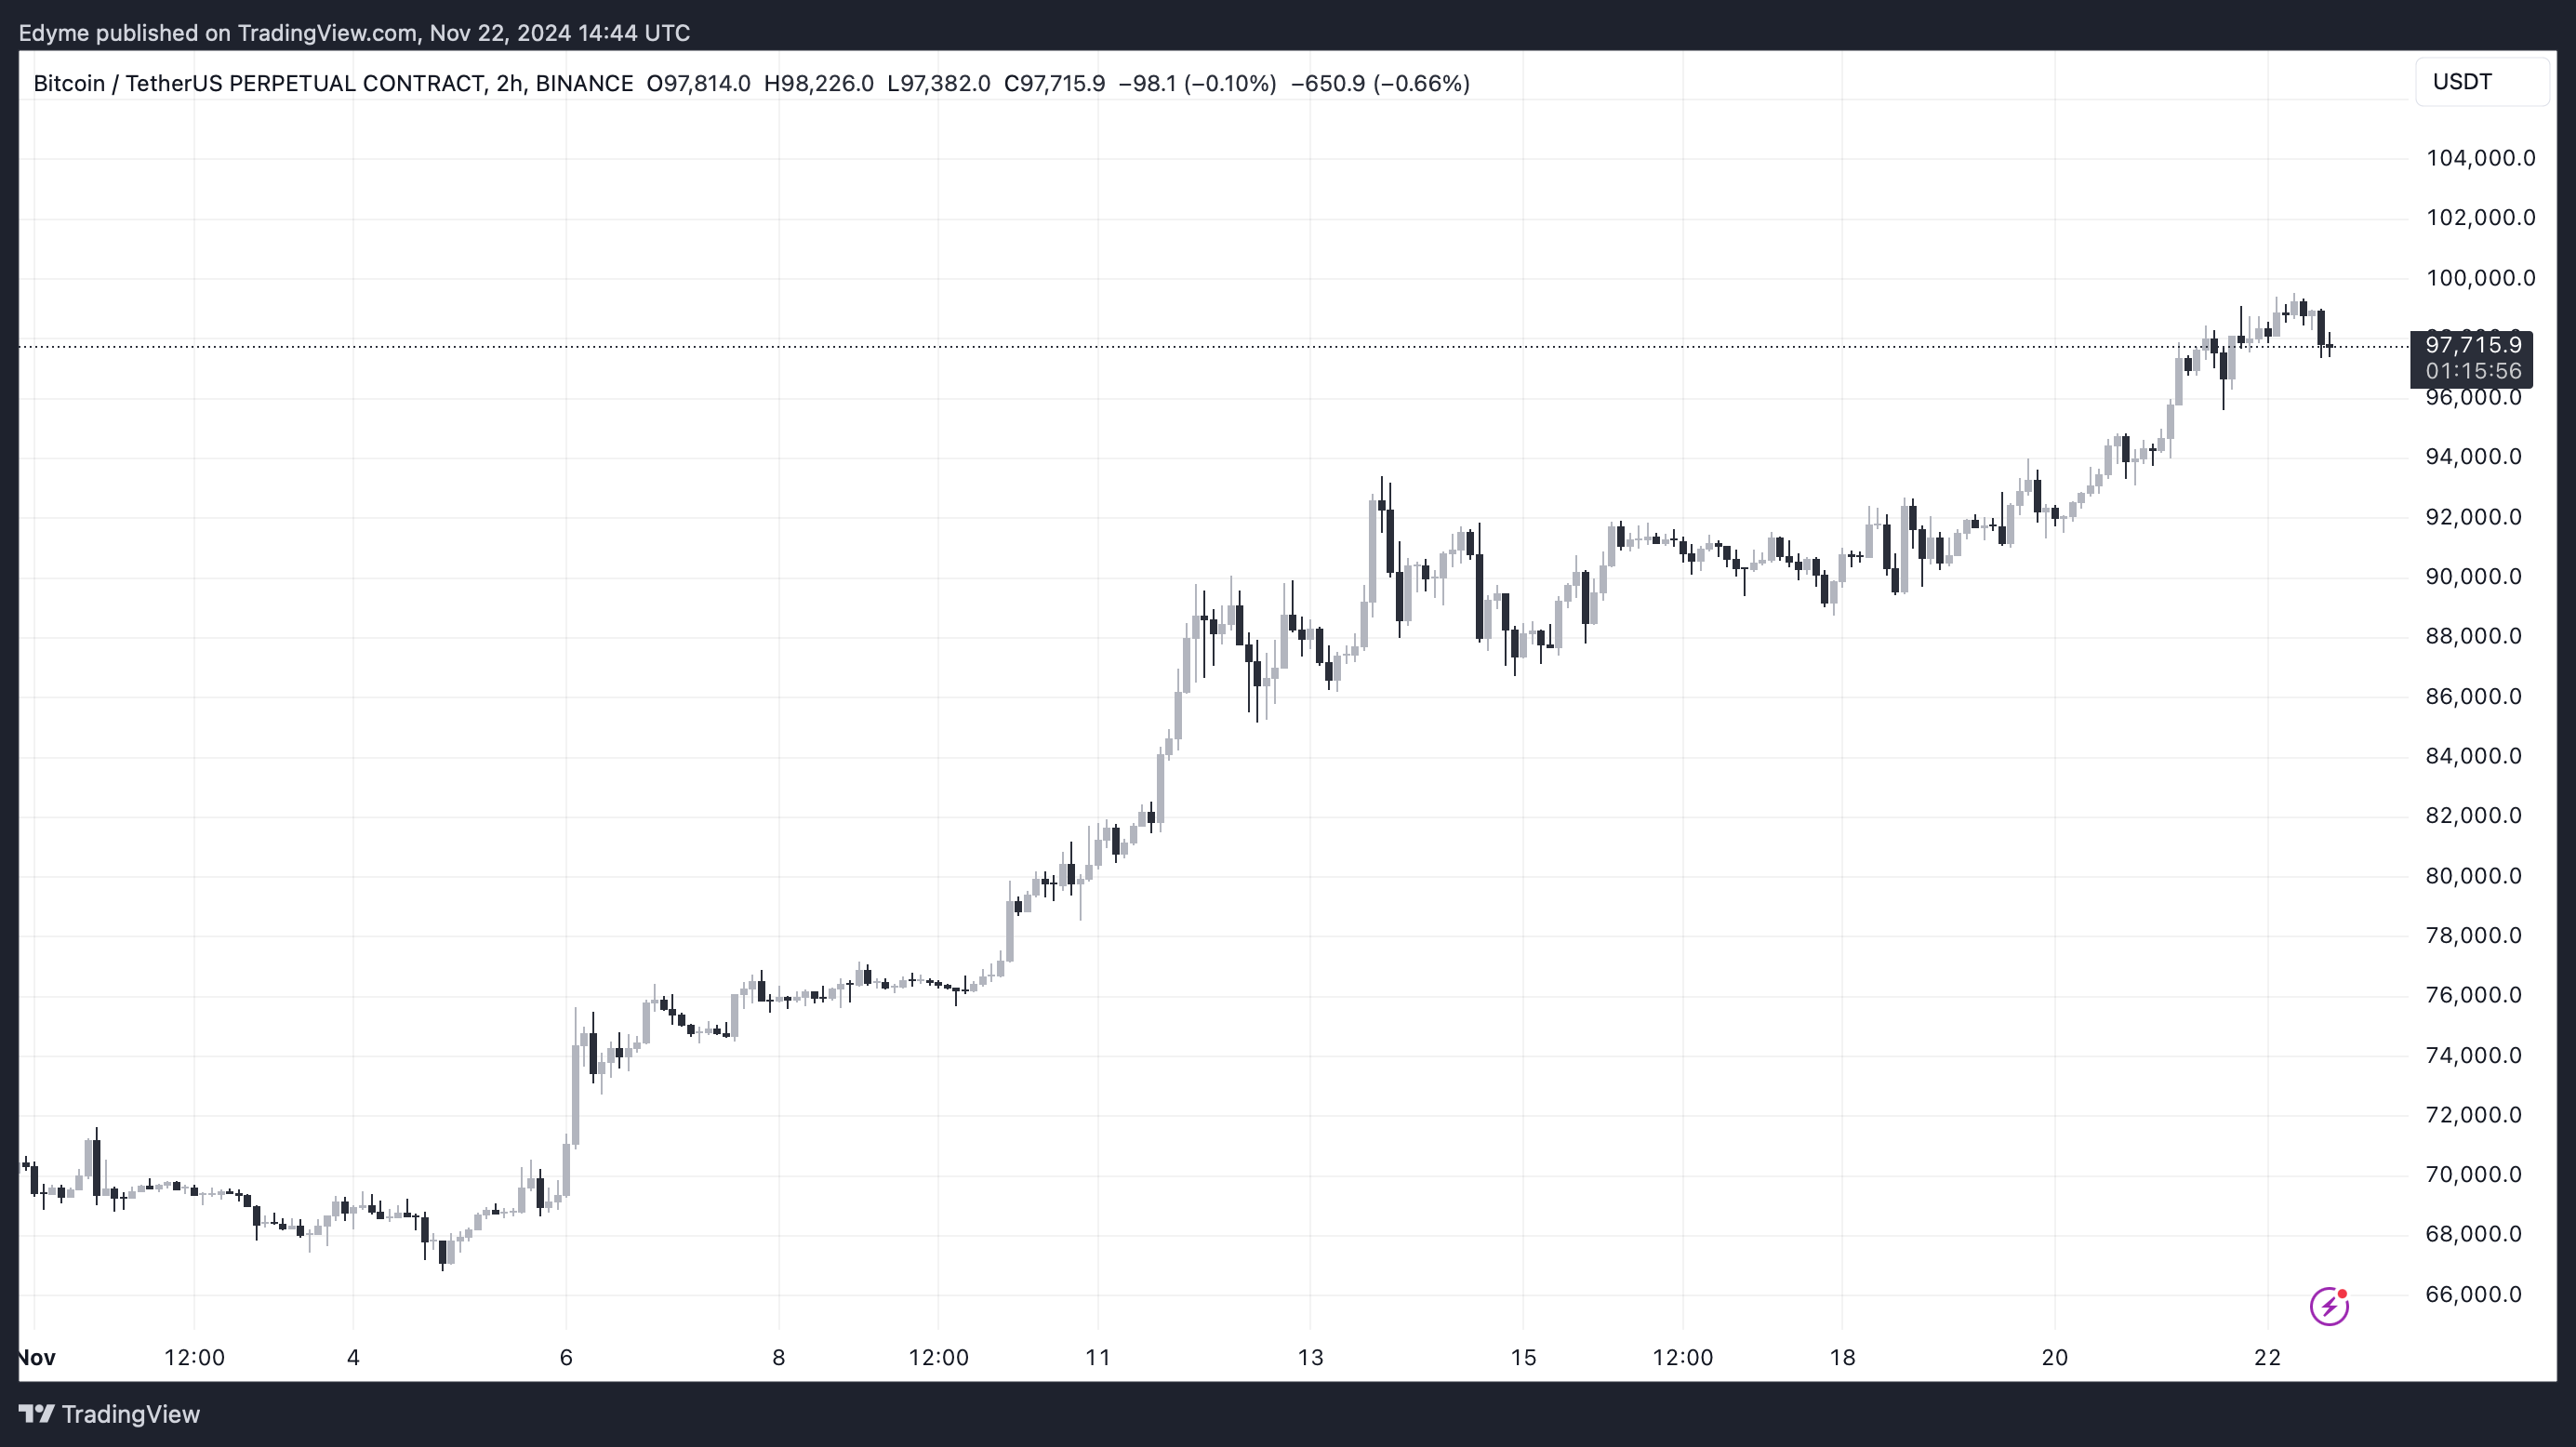
Featured image created with DALL-E, Chart from TradingView