Dec 4, 2025
5 0
Bitcoin Approaches $104,000 Target Amid Bullish Chart Patterns
Bitcoin is on the brink of a significant move, driven by two bullish patterns: the Cup & Handle and the Inverse Head and Shoulders (IH&S).
BTC Chart Analysis
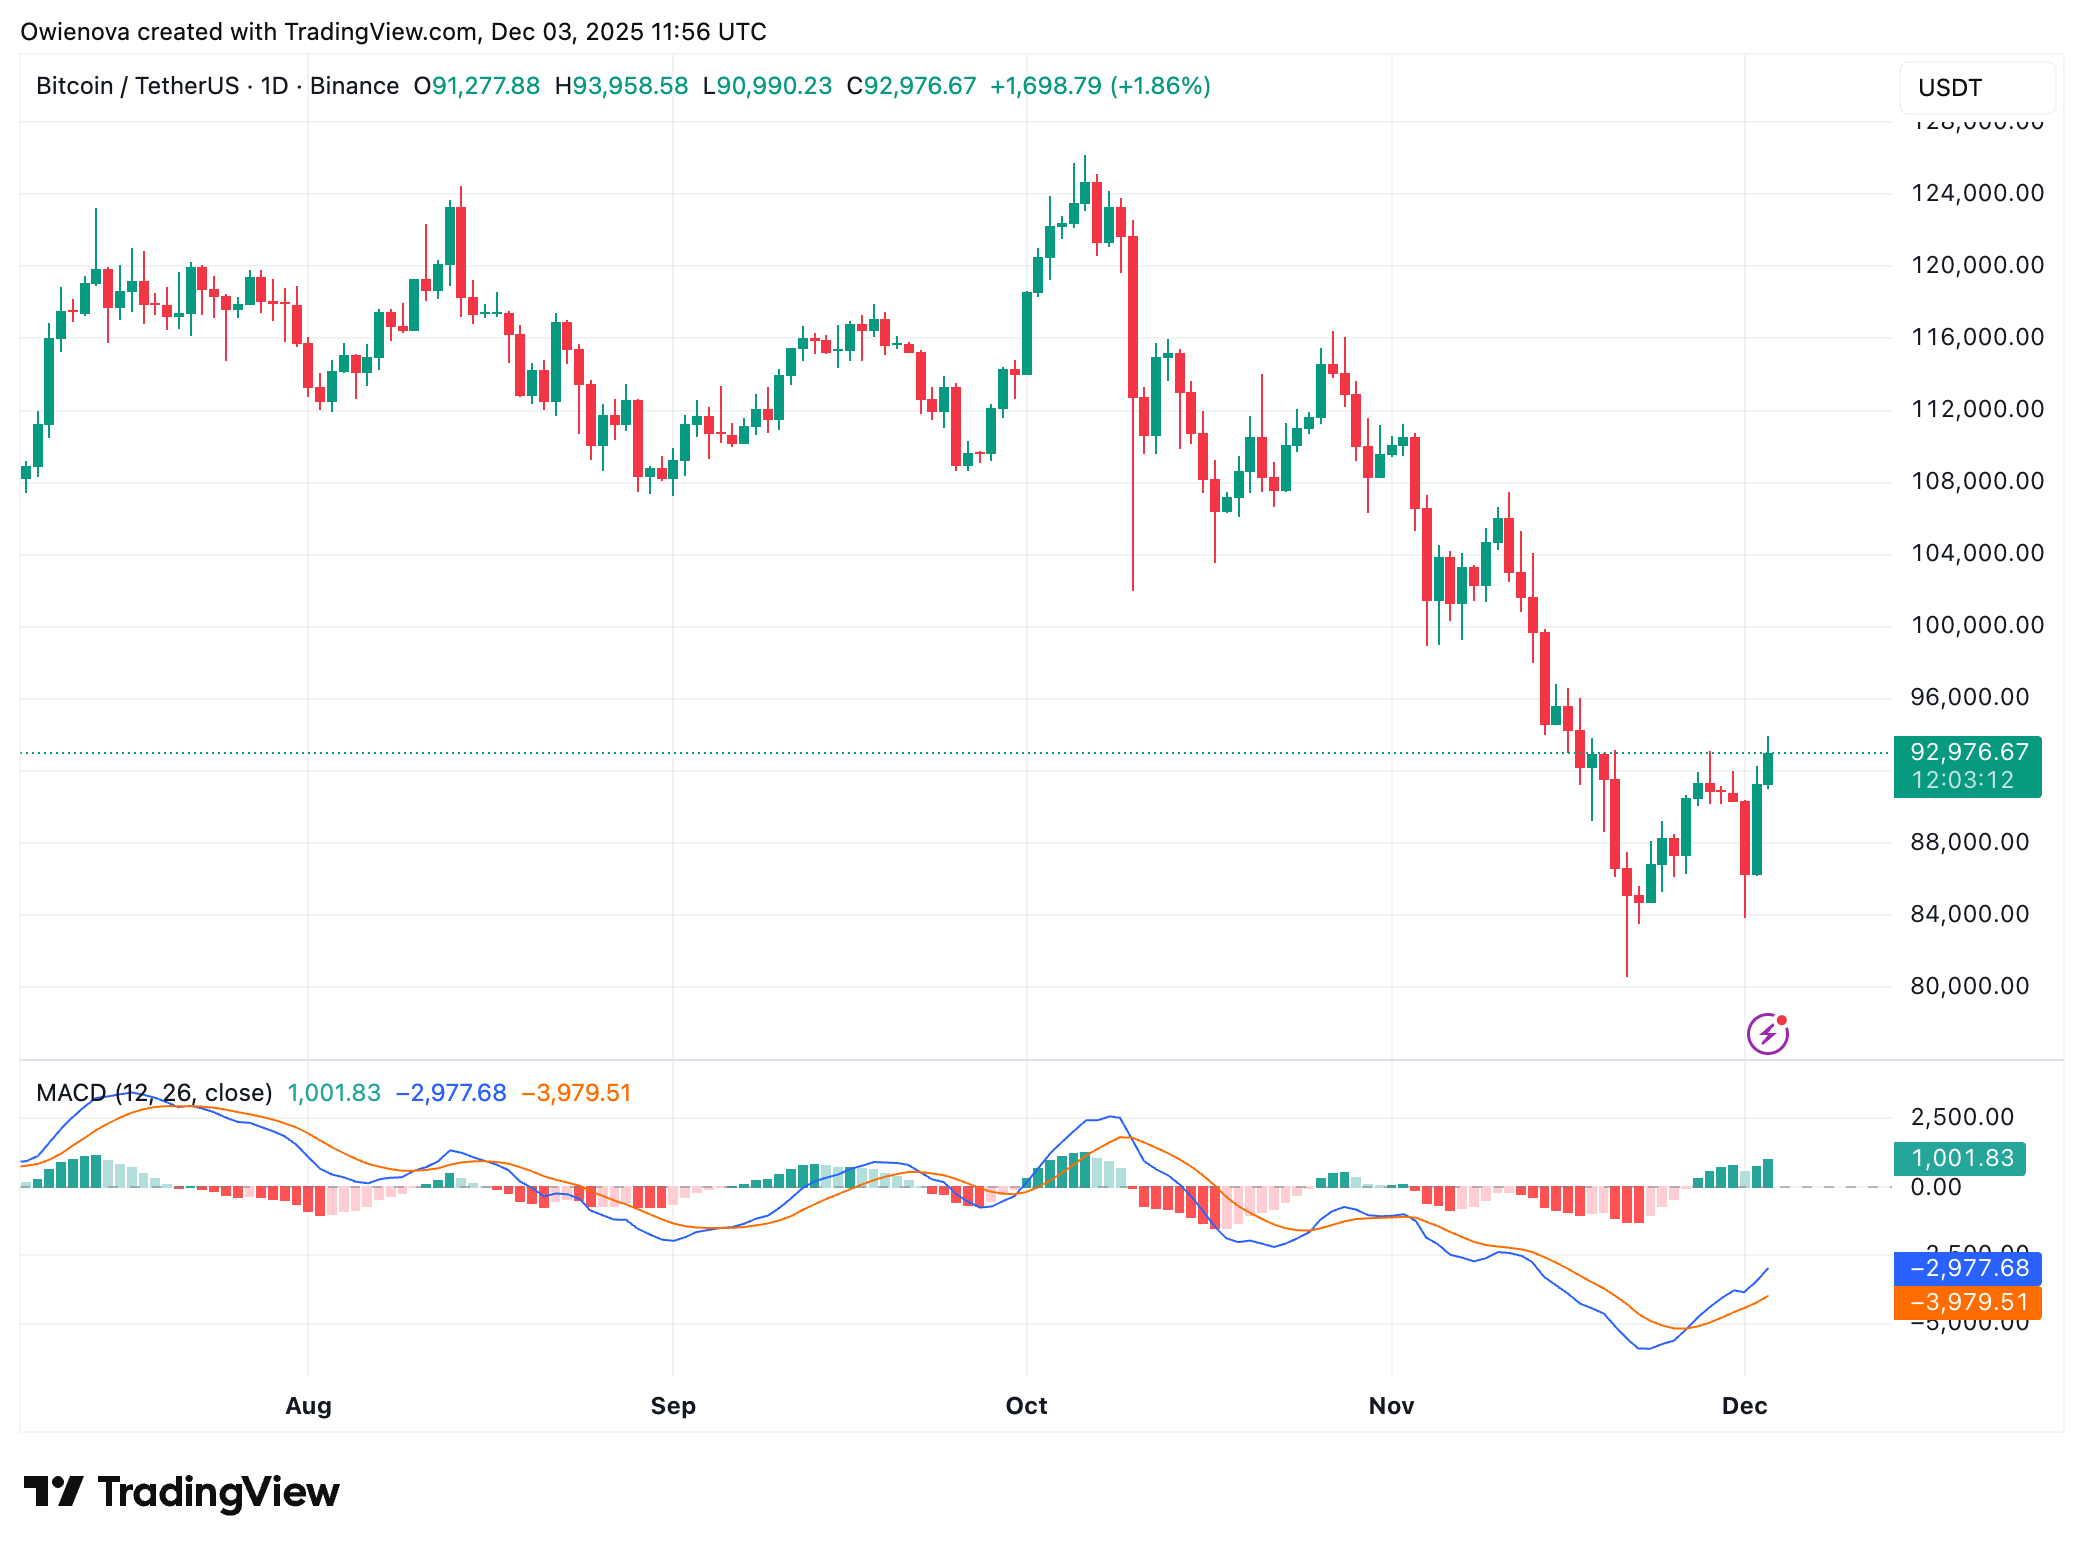
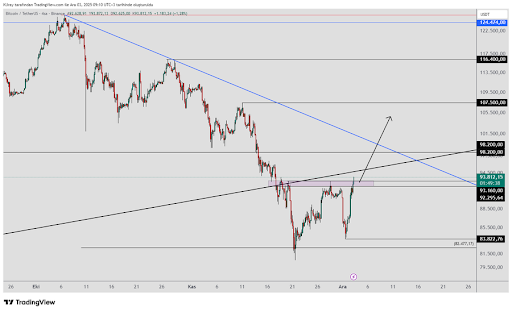
- BTC price is currently above $93,160. Analyst Kamile Uray indicates this could lead to a breakout targeting $104,000.
- A successful rise to $104,000 without reversal would break the existing downtrend line, indicating an ongoing uptrend.
- Next resistance levels are at $98,200 and $107,500, with a break above these confirming a long-term uptrend.
- Potential trade entries after breakout should consider stop-loss strategies for risk management.
- If BTC fails to hold above the handle resistance area, support lies between $83,822 and $82,477.
- A bearish scenario might push the market towards the next support zone of $74,496 - $71,237 if previous highs don't hold.
Inverse Head & Shoulders Pattern
- The IH&S pattern has confirmed a bullish reversal, as BTC surpassed $87,500 and broke through $90,000.
- Strong trading volume supports the current market structure, aiming next for the $95,000 technical benchmark.