Bitcoin’s Historical November Average Shows +46.02% Despite 2013 Skew
A Coinglass heatmap of Bitcoin's monthly returns highlights November as a month with significant variability in performance. Historical data from 2013 to 2025 shows that:
- November averages a +46.02% change, skewed by a +449.35% gain in 2013.
- Excluding 2013, the average November gain is roughly +9.35%.
- Out of 12 Novembers, 8 showed positive returns, with notable gains in 2013, 2017, and 2024.
- The median November change is +10.82%, reflecting more typical performance.
Overall, November is Bitcoin’s best month on record by average return, followed by October. However, it is also a period marked by significant volatility and market pivots, historically marking both tops and bottoms in Bitcoin cycles like those seen in 2013, 2017, and 2021.
The practical insight for investors is the recognition of regime risk during this time—volatility and major market shifts are common in the final months of the year. Despite the potential for gains, the historical pattern suggests variance rather than steady trends.
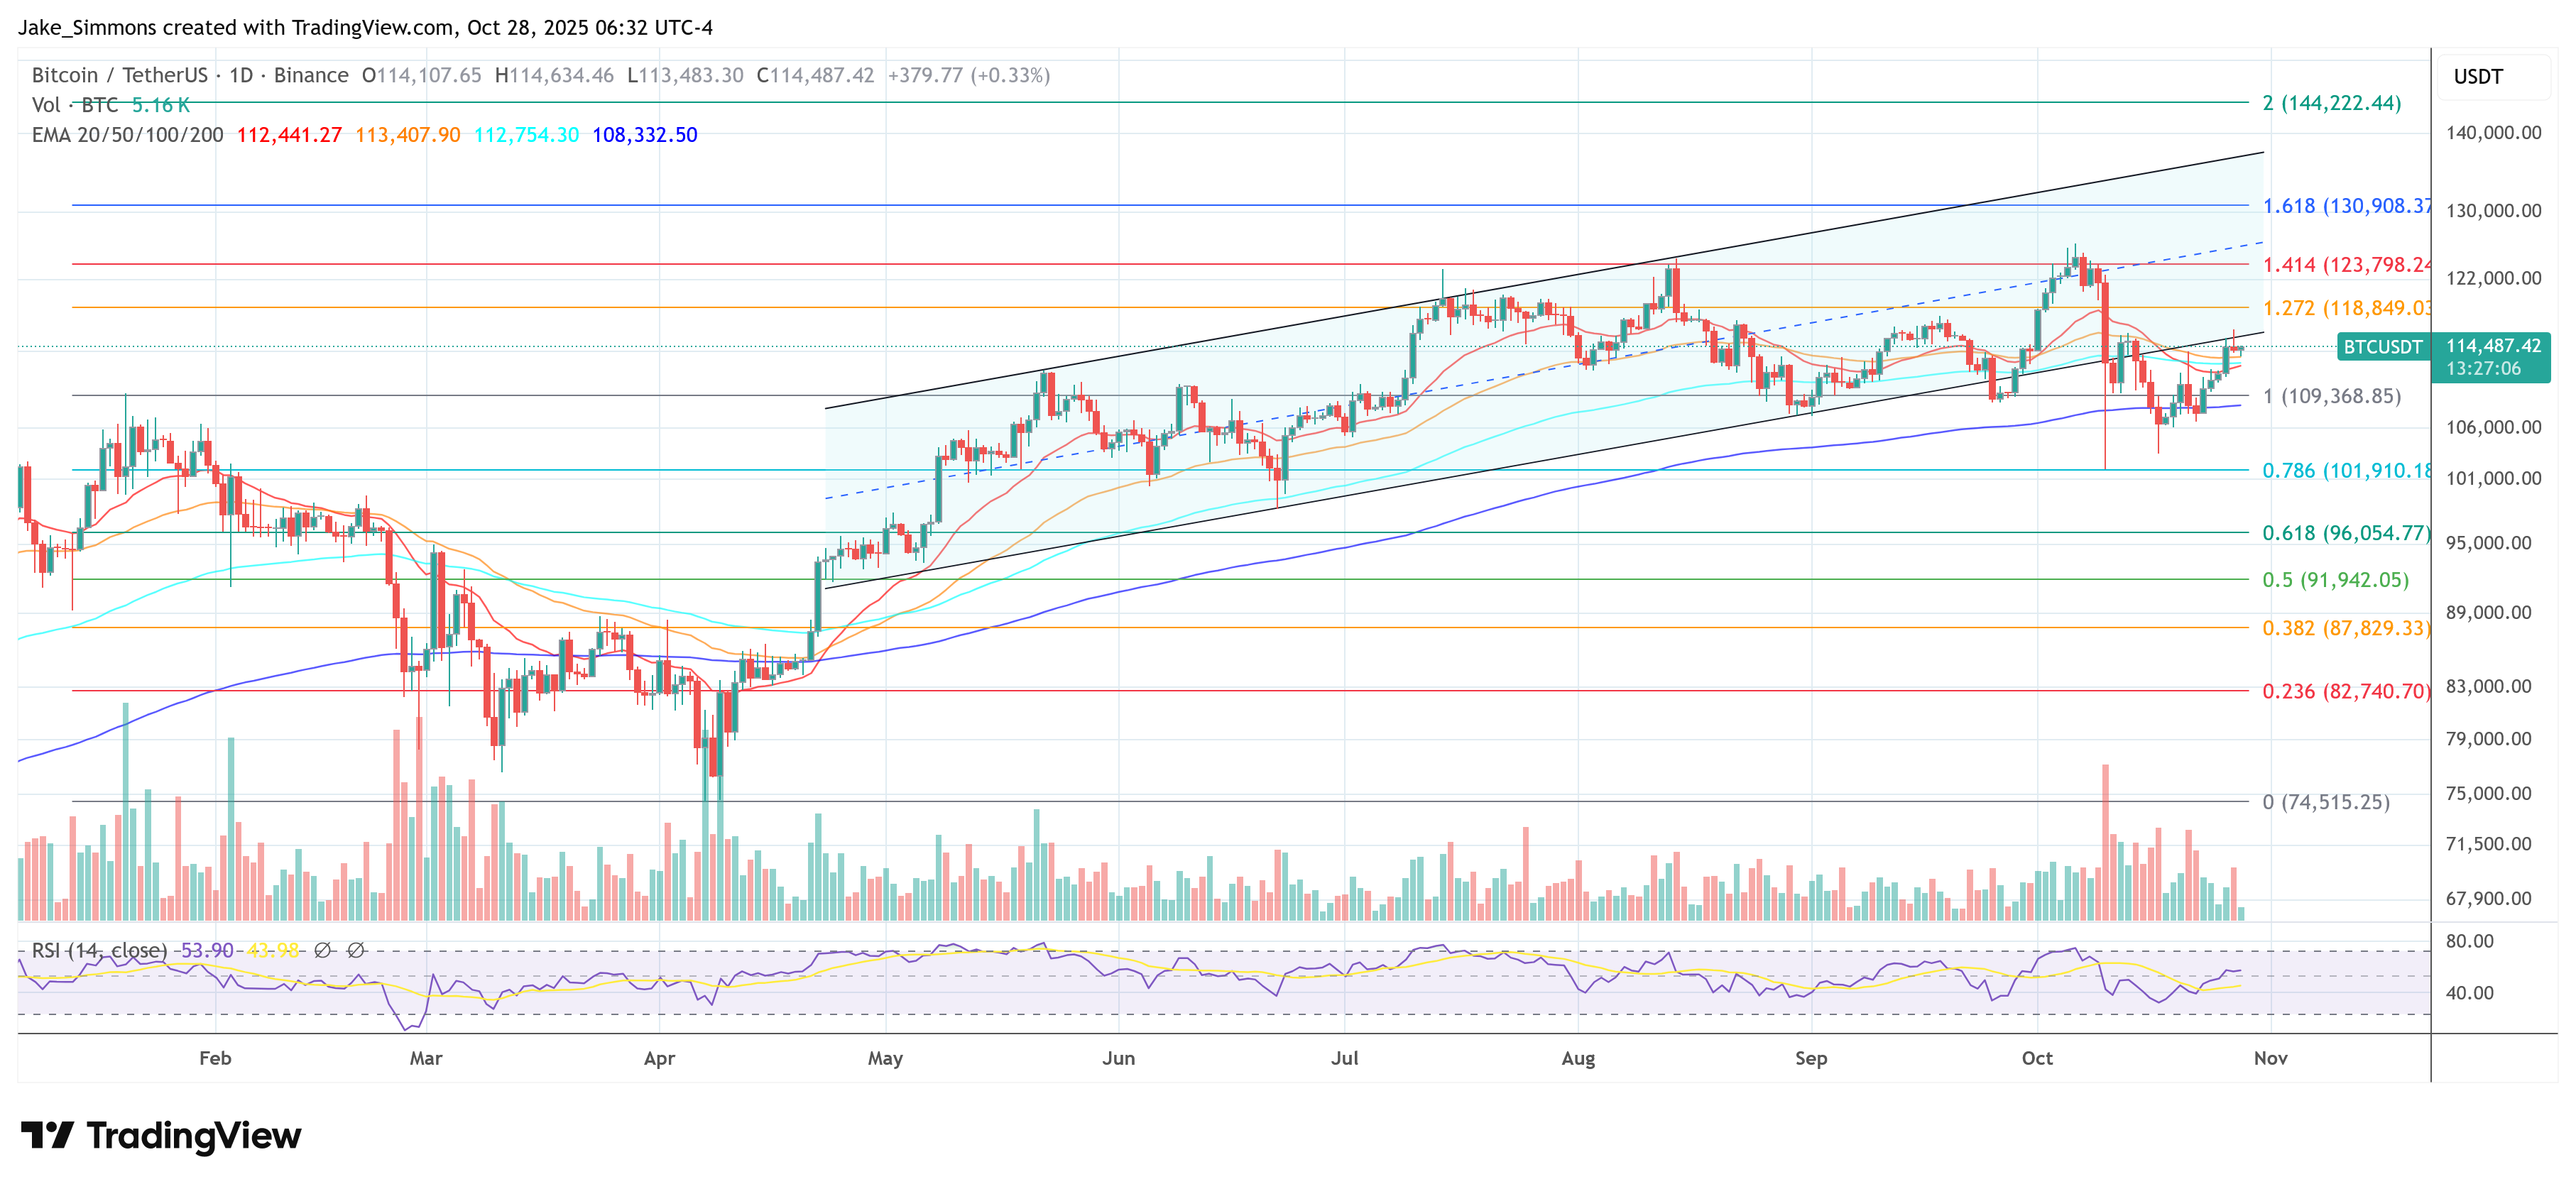
At the time of reporting, BTC traded at $114,487.