Jun 2, 2025
6 0
Bitcoin Price Consolidates Above $105,000 While Testing Key Resistance Levels
Bitcoin Price Analysis
- Bitcoin declined below $106,500, testing $103,200.
- Current trading above $105,000 and the 100 hourly SMA.
- Bearish trend line resistance at $105,550 on the hourly chart.
- Potential for increase if resistance at $106,000 is cleared.
Price Movement Overview
Bitcoin price has fallen below the $106,500 support zone and tested a low at $103,200. A consolidation phase is underway with a recent rise above $104,200 and the 23.6% Fibonacci retracement level from $110,500 to $103,200.
Immediate resistance levels are at $105,550 and $106,000, with a potential further rise to $106,800, aligning with the 50% Fibonacci retracement level.
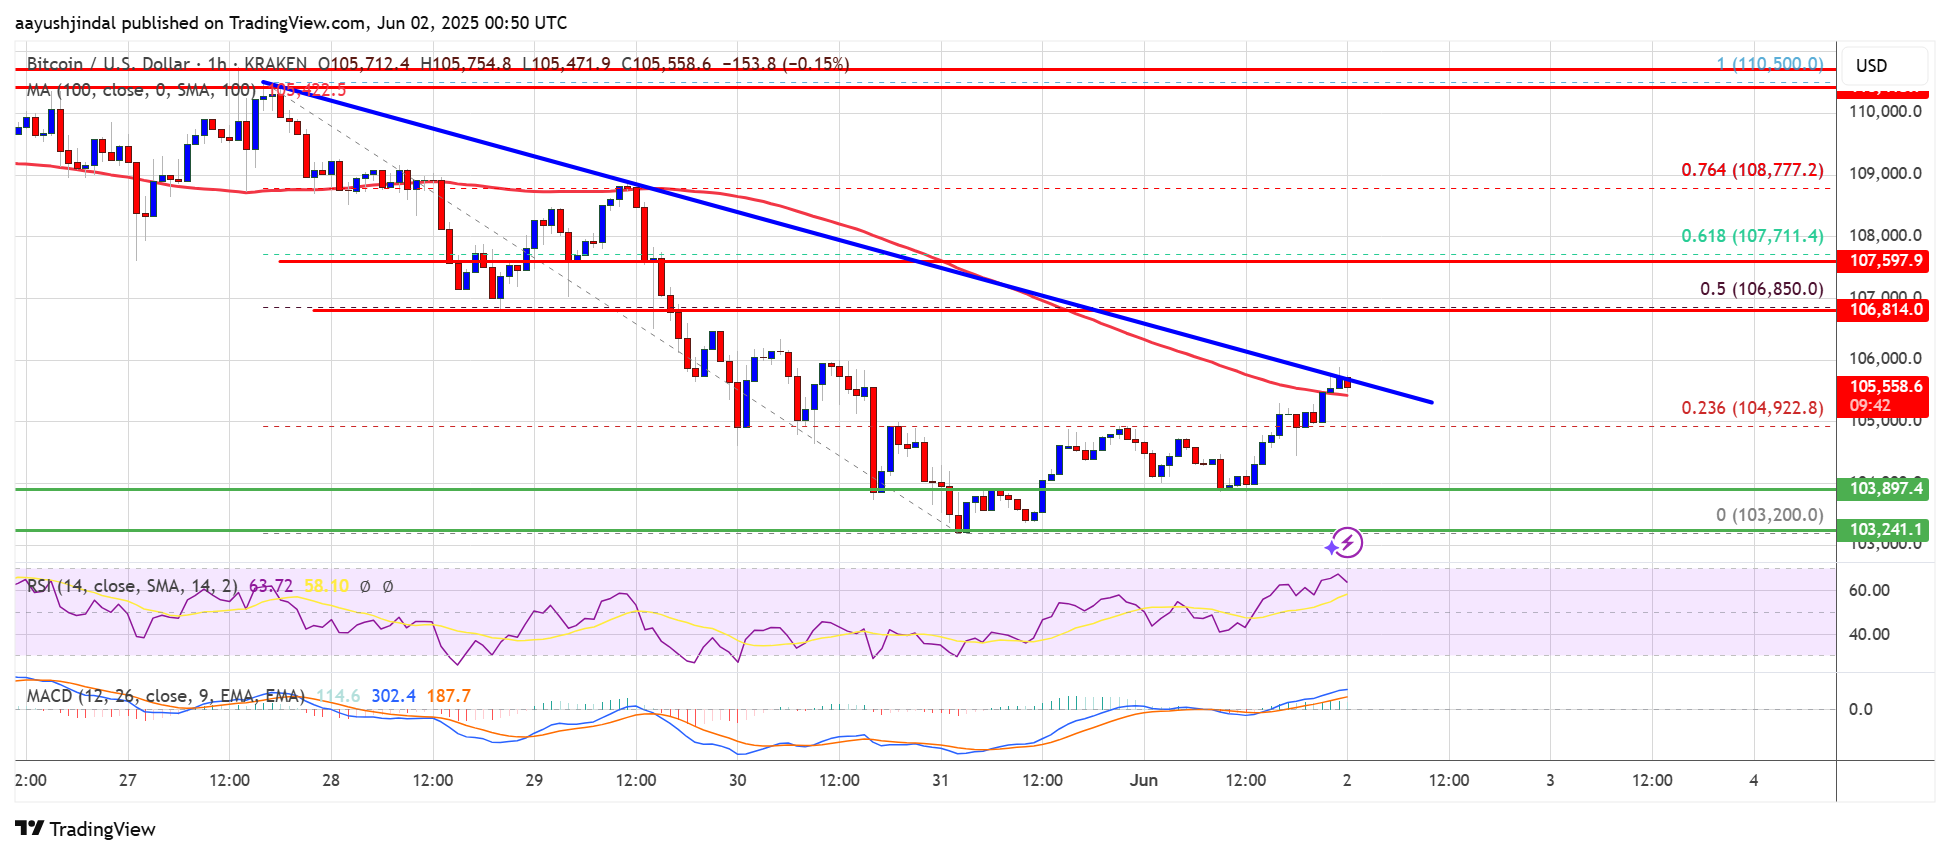
A close above $106,800 may lead to testing $108,000 and possibly $110,000.
Potential Downward Movement
If Bitcoin does not surpass $106,000, it may decline again. Key supports are at $105,000, $104,200, and $103,200. Further losses could reach $102,500, with main support at $101,200, which may indicate bearish momentum.
Technical indicators show:
- Hourly MACD gaining bullish momentum.
- RSI above 50.
- Major support at $105,000 and $104,200.
- Major resistance at $106,000 and $106,800.