May 13, 2025
7 1
Bitcoin Price Corrects Below $103,500 Resistance Zone
Bitcoin Price Update
- Bitcoin surged above $102,500 but is currently correcting below $103,500.
- The price is under $104,000 and the 100-hourly Simple Moving Average.
- A break occurred below a bullish trend line at $103,900 on the BTC/USD hourly chart.
- A potential increase may occur if Bitcoin clears the $103,500 resistance.
Price Movements
Bitcoin started increasing from the $98,500 support, surpassing $100,000 and reaching a high of $105,728. Currently, it is correcting after falling below the 23.6% Fibonacci retracement level of the upward movement from the $95,825 low.
Bulls are active near the $100,800 support, defending the 50% Fibonacci retracement level. Immediate resistance is at $103,500 with key resistance at $104,000.
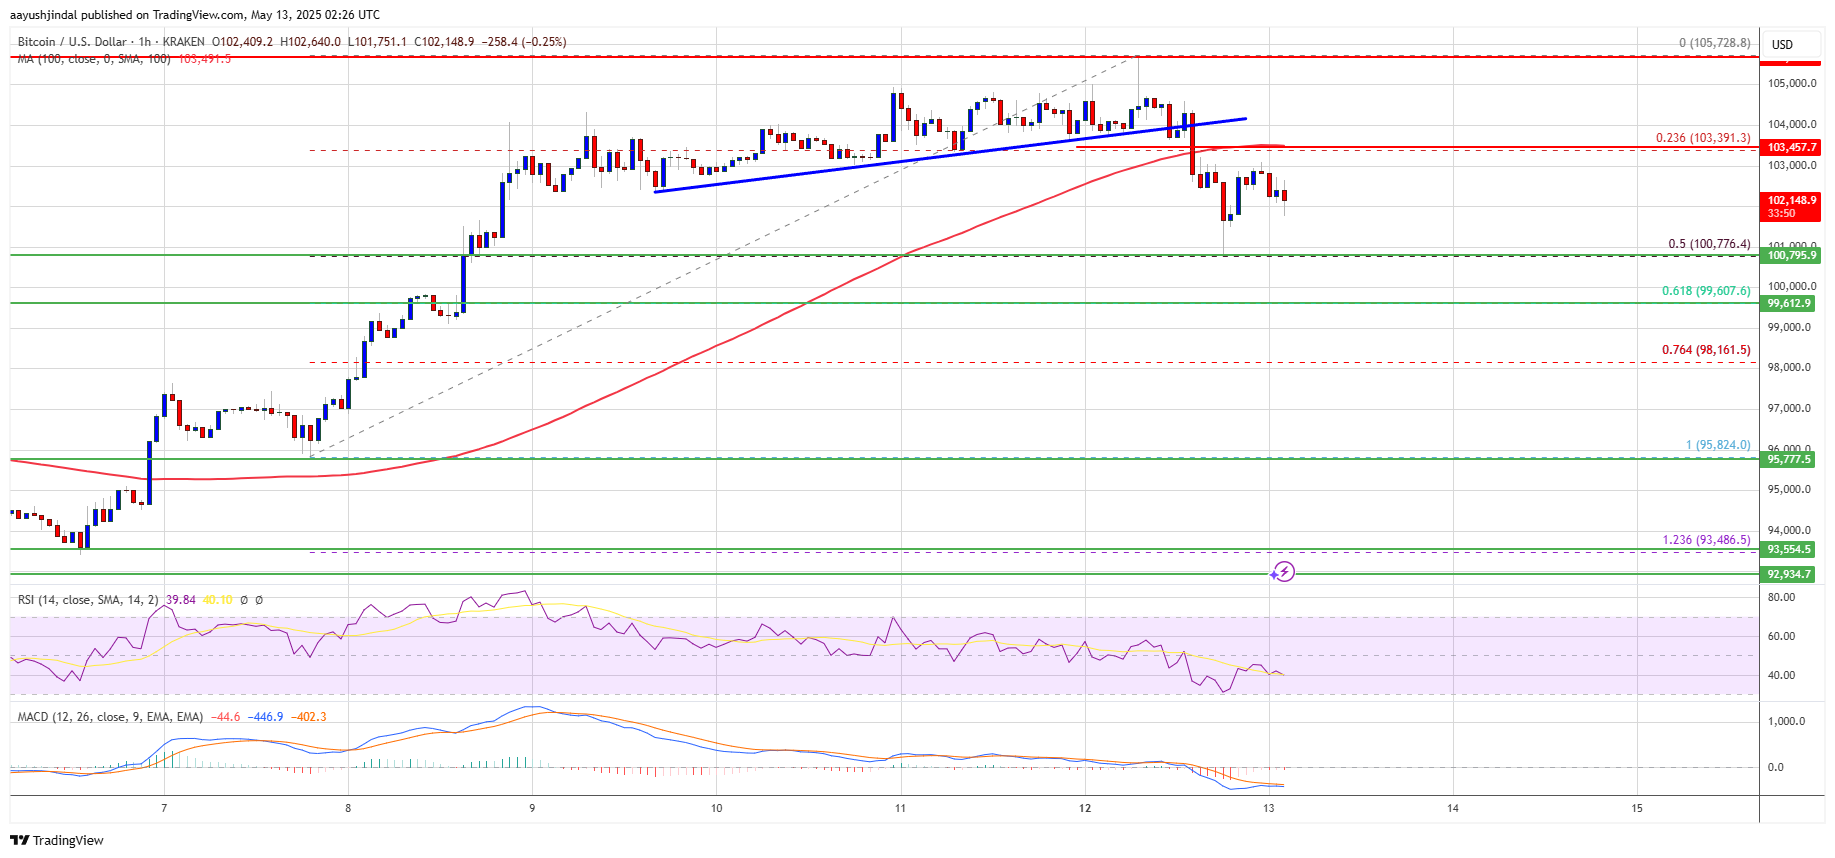
The next key resistance could be $105,000. A close above this level may lead to testing $106,000 and potentially $108,000.
Downside Risks
If Bitcoin cannot rise above $103,500, it may face further corrections. Key support levels include:
- $101,500
- $100,800
- $100,000
- $98,800
- $97,500 (main support)
Technical indicators show that the Hourly MACD is losing momentum in the bullish zone, and the RSI is below 50.