Bitcoin Price Could Decline to $89,000 If Resistance Levels Fail
The Bitcoin price may decline if it cannot maintain key resistance levels. Analysts suggest a drop to $89,000 is possible due to ongoing sell-offs below $100,000, which hinder its upward momentum.
Bitcoin Price Correction To $89,000 Possible
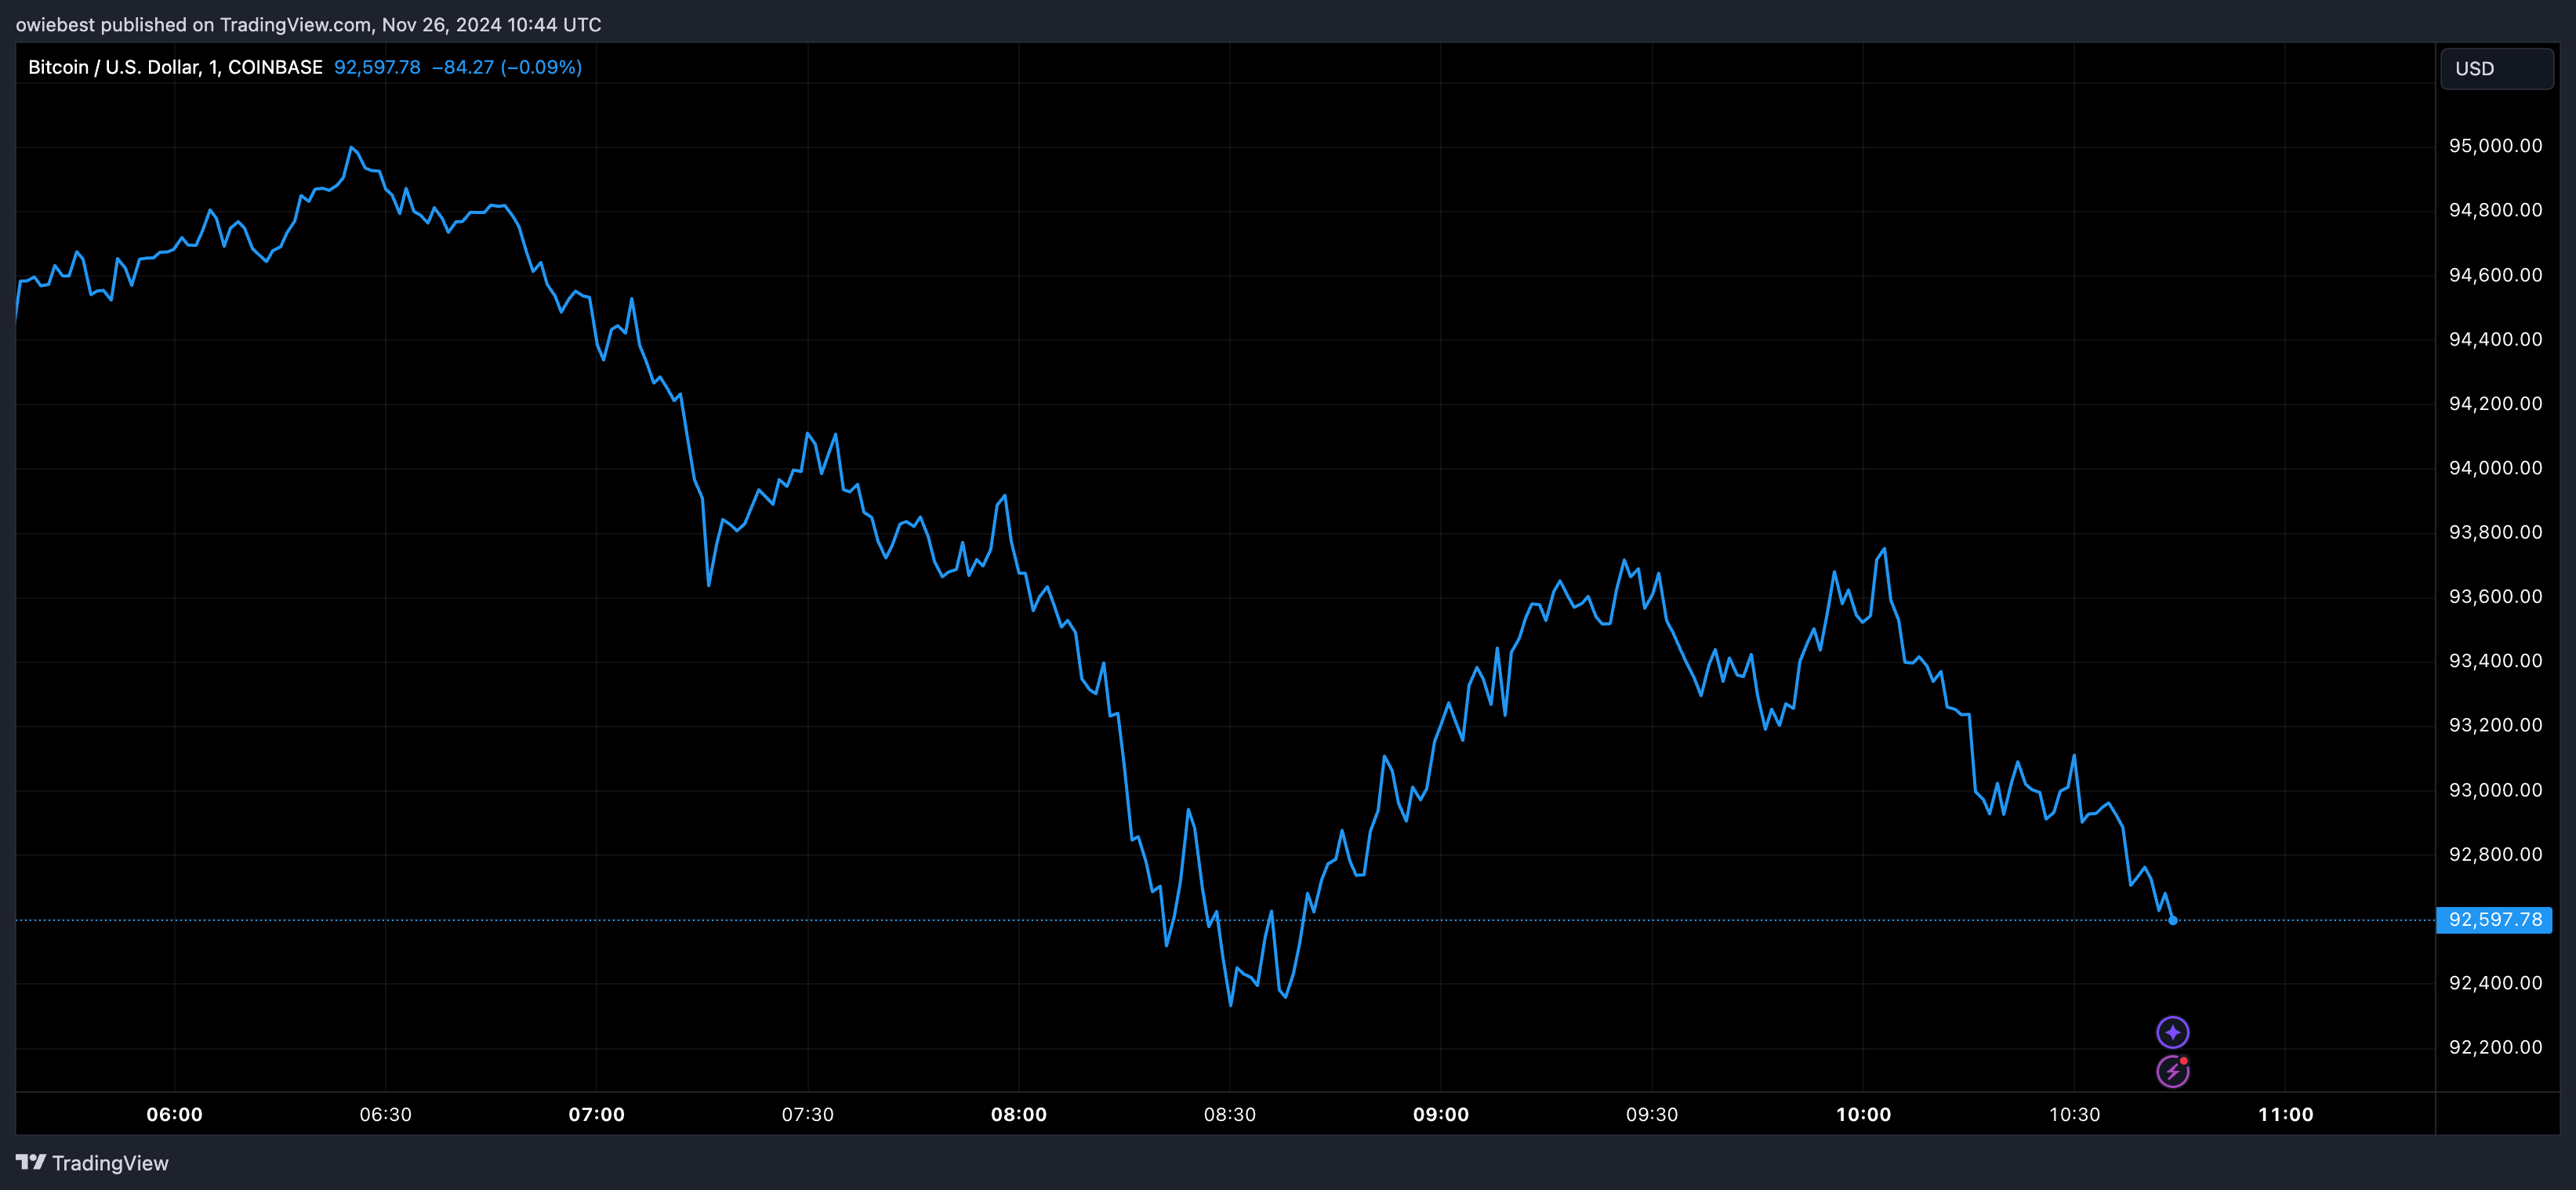
On November 26, TradingView analyst Pejman Zwin presented a technical analysis chart of Bitcoin's price movements in a 1-hour time frame. The chart indicated crucial resistance lines, support zones, and technical indicators signaling a potential crash.
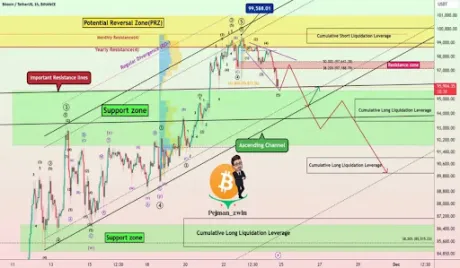
A yellow zone on the chart represents the Potential Reversal Zone (PRZ), where Bitcoin is expected to encounter significant resistance as it approaches the $100,000 mark. A horizontal resistance line around $95,904 has historically posed challenges for Bitcoin to surpass.
Currently, at resistance levels between $97,000 and $98,000, Zwin noted that a successful breakout could lead Bitcoin toward $100,000. Conversely, failure to reach these levels could trigger a substantial price decline. The chart shows green zones indicating critical support areas where Bitcoin might recover if a correction occurs.
If Bitcoin drops below support levels of $95,600 to $92,000 and breaches the ascending channel's lower line, Zwin predicts a potential crash to $89,000 during this bull cycle. This level corresponds to the cumulative long liquidation leverage, indicating a potential correction between $91,000 and $89,000, representing an 8% to 10% drop.
Key Factors Pushing The BTC Price Upwards
Conversely, Zwin highlighted positive market sentiment fueled by recent developments in the crypto sector as a driving force behind Bitcoin's rise. Notably, a Chinese Court ruling affirming the legality of Bitcoin and crypto ownership has significantly impacted BTC's price increase.
Additionally, Donald Trump's intention to appoint a White House crypto advisor has contributed positively to Bitcoin's price, helping it break through important resistance lines.
Zwin's analysis indicates Bitcoin has entered five new impulsive waves as per Elliott wave theory after surpassing key resistance lines. Furthermore, the chart reveals a “Bump and Run Top Pattern,” suggesting that if Bitcoin rises above $98,700, it could potentially reach $100,000.