Bitcoin Price Dips Below $96,500 Amid Fresh Decline
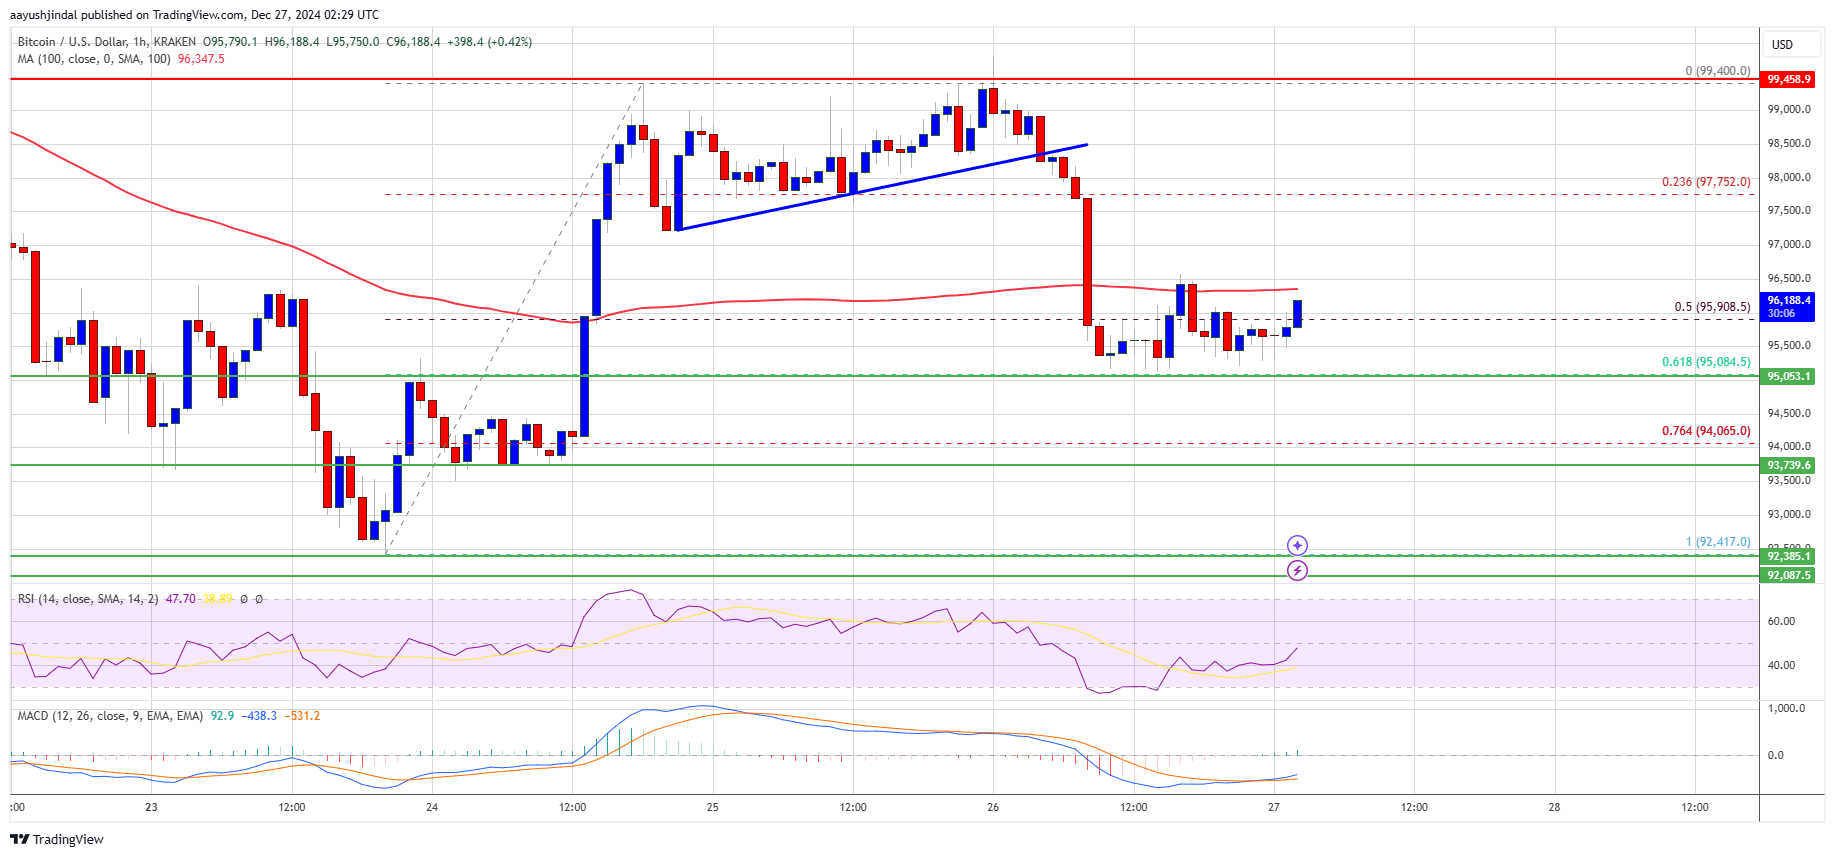
Bitcoin price failed to surpass $100,000, correcting to below $96,500 and may revisit the $93,200 support zone.
- Bitcoin began a decline from the $99,400 zone.
- The price is trading under $96,500 and the 100 hourly Simple Moving Average.
- A break occurred below a bullish trend line with support at $98,400 on the hourly BTC/USD chart (data feed from Kraken).
- The pair could initiate another increase if it remains above the $95,000 support zone.
Bitcoin Price Dips Again
Bitcoin started an upward movement above the $96,500 resistance zone. It rose past the $97,500 and $98,000 resistance levels.
The price cleared the $99,000 resistance level, nearing $100,000, with a high at $99,400 before starting a fresh decline. The price dropped below the $96,500 support and fell beneath the 50% Fib retracement level of the upward wave from $92,415 to $99,400.
A break occurred below a bullish trend line with support at $98,400 on the hourly BTC/USD chart. Bitcoin is currently trading below $96,500 and the 100 hourly Simple Moving Average.
Currently, Bitcoin holds near the $95,000 zone and the 61.8% Fib retracement level from $92,415 to $99,400. Immediate resistance is near $96,400, with key resistance at $97,750.
A move above $97,750 may lead to higher prices, potentially testing the $99,000 resistance. A close above this level could push the price toward $100,000, with further gains targeting $102,000.
More Losses In BTC?
If Bitcoin does not rise above $96,500, it may continue to decline. Immediate support is near $95,200.
Major support is at $95,000, with additional support near $93,800. Further losses could lead to a drop toward $92,500.
Technical indicators:
- Hourly MACD – Gaining pace in the bearish zone.
- Hourly RSI (Relative Strength Index) – Below the 50 level.
- Major Support Levels – $95,000, followed by $93,800.
- Major Resistance Levels – $96,500 and $97,750.
