Jan 19, 2026
1 0
Bitcoin Price Declines Below $93,500 Amid Risk of Further Losses
Bitcoin Price Analysis:
- Bitcoin is experiencing a decline, trading below $95,000 and $94,000.
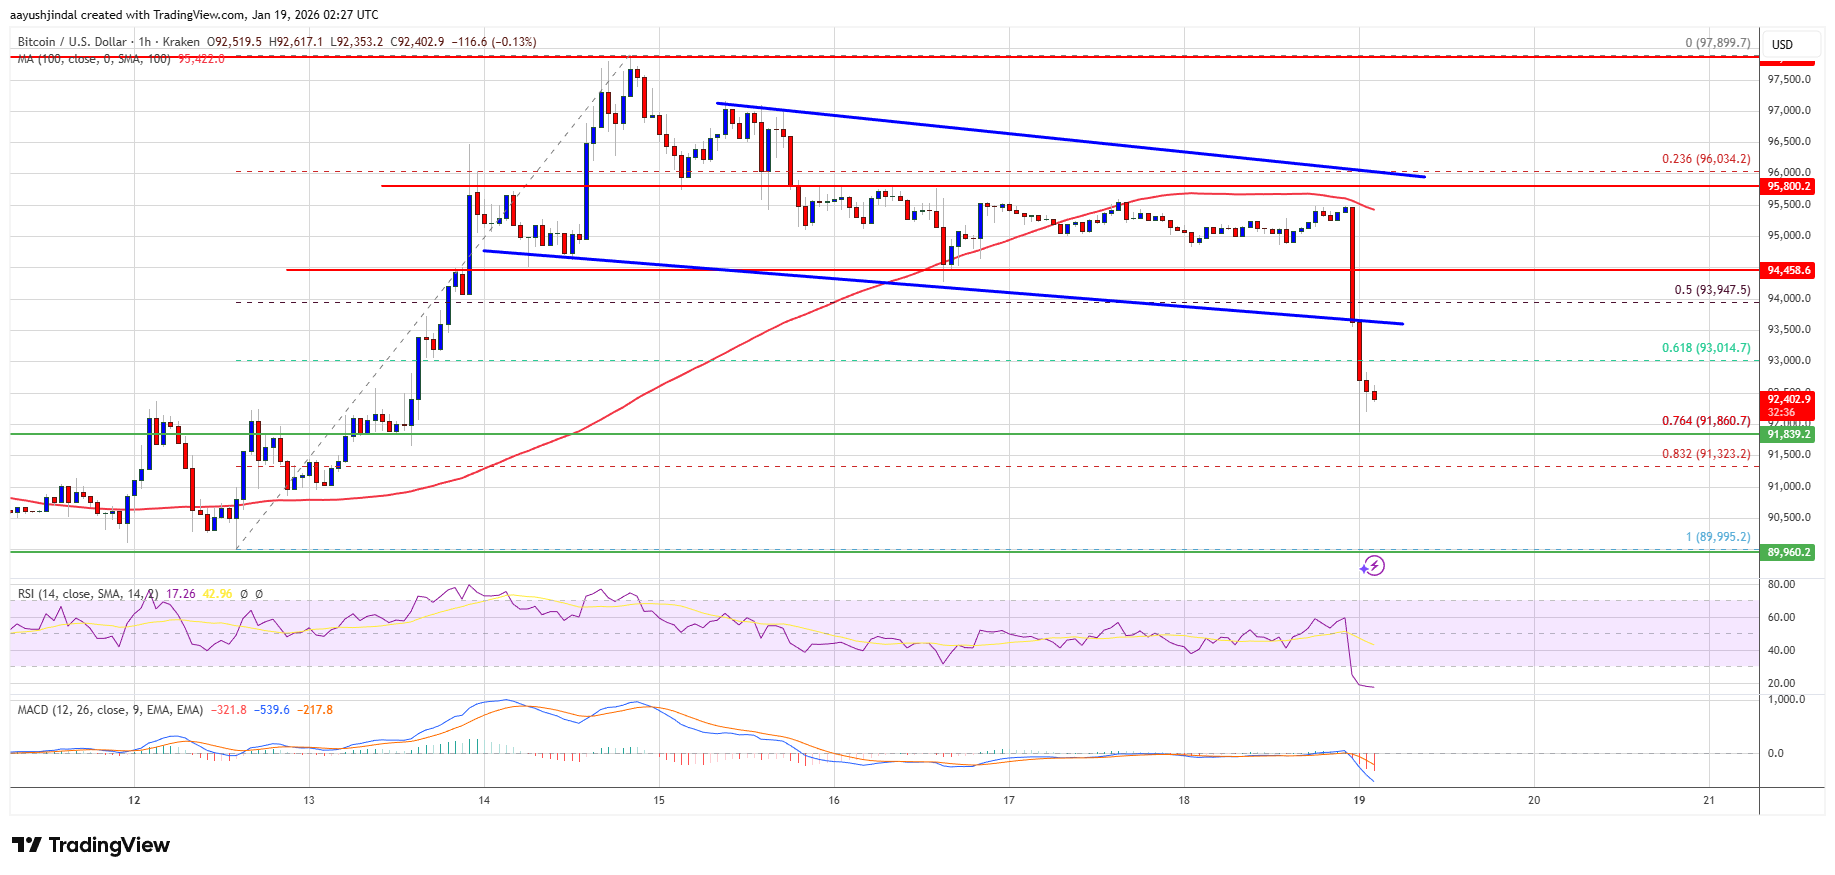
- The price is currently below $93,500 and the 100 hourly Simple Moving Average (SMA).
- A break occurred below a declining channel with support at $93,550 on the BTC/USD hourly chart.
- If Bitcoin remains under the $95,000 zone, further declines are possible.
Current Price Movements
- Bitcoin dropped beneath key support levels at $94,500 and $93,500.
- The price fell below the 61.8% Fib retracement from $89,995 to $97,898.
- A spike was observed below $92,000, testing the 76.4% Fib level of the same range.
- Bitcoin is now below $93,500 and the 100-hour SMA.
Potential for Recovery
- If Bitcoin remains stable above $92,000, a rebound could occur.
- Resistance levels are at $93,000 and $93,500.
- Breaking above $94,000 may lead to further gains towards $95,000 and potentially $96,200-$96,400.
Downside Risks
- Failure to surpass $93,500 could trigger another drop.
- Support levels are at $92,000, $91,800, and $90,500.
- Main support is at $90,000; falling below this could accelerate losses.
Technical Indicators:
- Hourly MACD: Losing momentum in the bearish zone.
- Hourly RSI: Below 50, indicating weakness.
- Key Support Levels: $92,000, $91,800.
- Key Resistance Levels: $93,000, $93,500.