Bitcoin Price Drops Below $95,000 Amid NVT Golden Cross Signals
Bitcoin's price correction from its recent all-time high has raised questions in the crypto community regarding the sustainability of the bull run and potential future price movements.
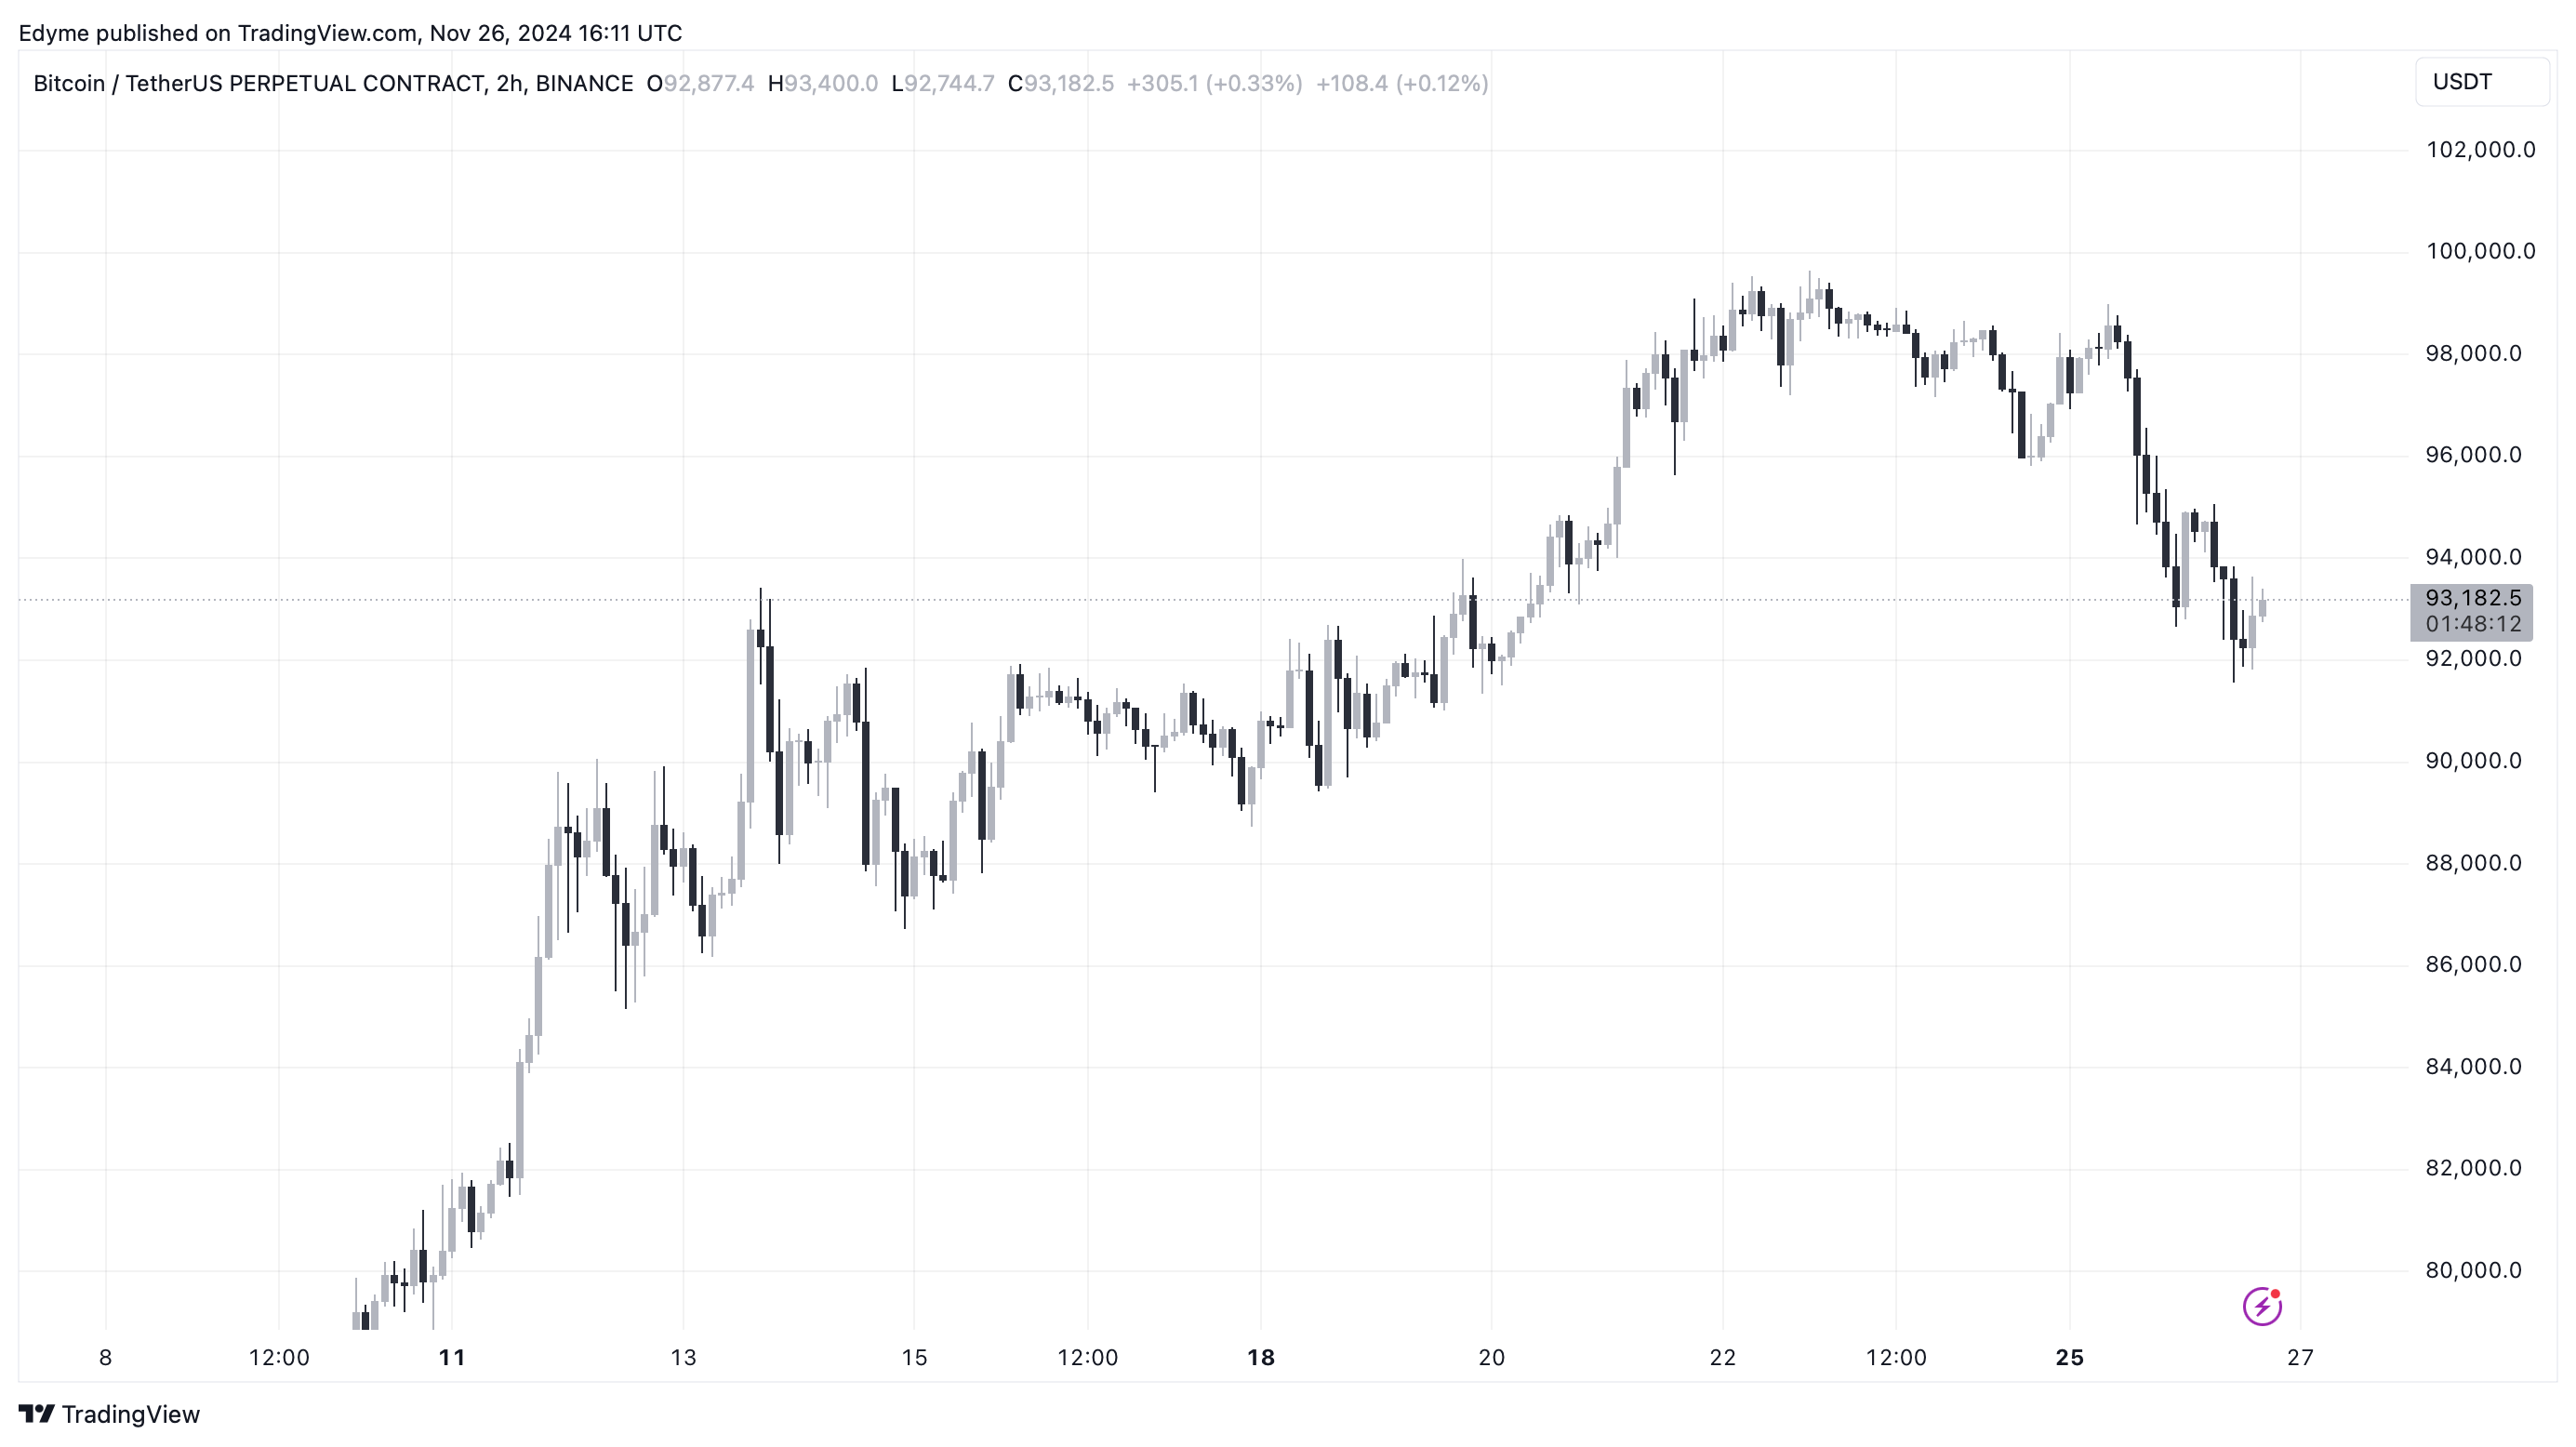
Currently, BTC is trading below $95,000, reflecting a decline of nearly 7% from its peak above $99,000 recorded on November 22.
BTC NVT Golden Cross Outlook
Amid this price pullback, CryptoQuant analyst Darkfost provided insights on the market, emphasizing a significant on-chain metric: the NVT Golden Cross. This metric, assessing the relationship between market capitalization and transaction volume, recently turned positive.
Darkfost cautioned against viewing this shift as inherently bullish, noting that while the low NVT Golden Cross value does not present substantial risks, traders should monitor it to avoid market pitfalls.
The NVT Golden Cross can serve as a leading indicator for market trends. If the metric rises to 2.2, it suggests Bitcoin’s valuation exceeds its transactional utility.
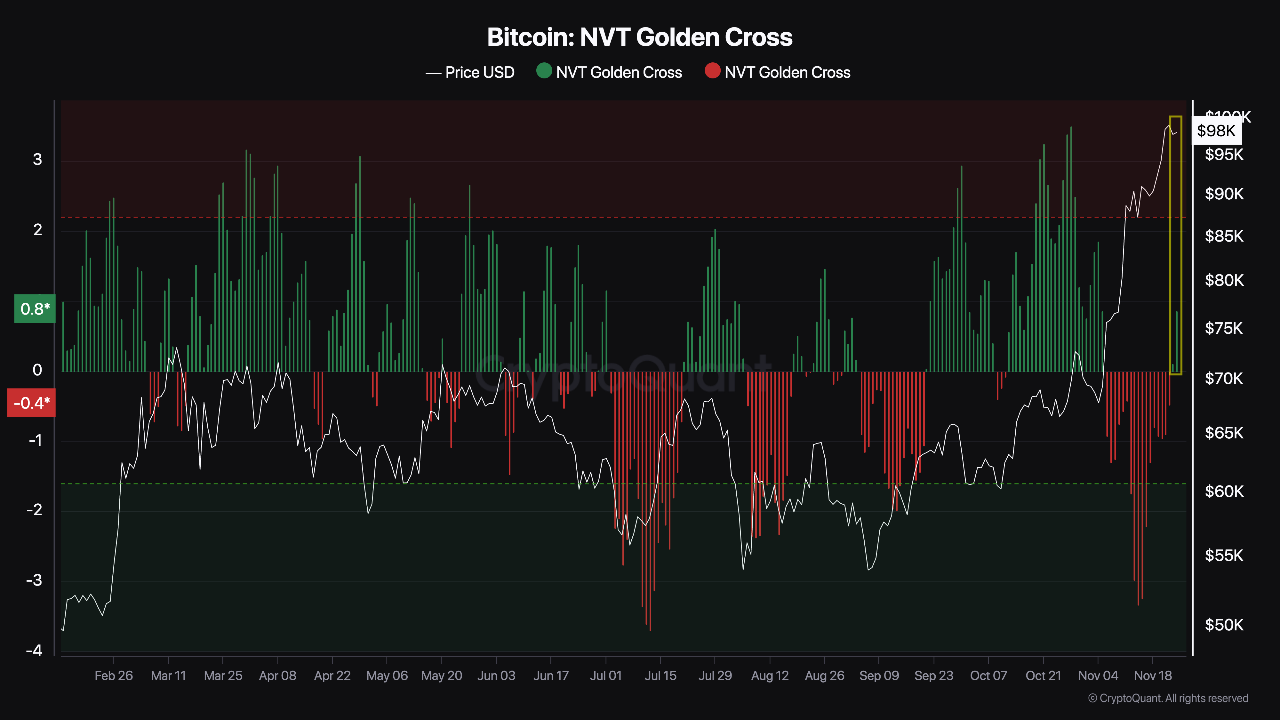
In such scenarios, Darkfost indicated a potential "reversion to the mean," signaling possible opportunities for short positions. He added:
This scenario could lead to the beginning of a ranging pattern, which might create a favorable environment for altcoins to perform.
Bitcoin Performance Outlook
As Bitcoin trades at $93,196, down by 3.3% in the past day, analysts are assessing the situation through various lenses.
The crypto market has seen notable volatility, with approximately 191,493 traders liquidated in the past 24 hours, amounting to $571.80 million in total liquidations, according to CoinGlass data.
IntoTheBlock highlighted a fundamental reason behind Bitcoin's correction: "elevated funding rates," indicating “excessively leveraged positions”.
However, IntoTheBlock noted that funding rates have largely normalized, suggesting that the "leverage flush may have run its course."
From a technical perspective, Bitcoin may be preparing for a reversal. Analyst Ali reported that the TD Sequential for BTC is now showing a "buy signal."
The TD Sequential presents a buy signal on the #Bitcoin $BTC hourly chart, while a bullish divergence forms against the RSI, which could help #BTC rebound to $95,000 – $96,000!
— Ali (@ali_charts) November 26, 2024
Featured image created with DALL-E; Chart from TradingView.