Bitcoin Price Hits $105,000 ATH Amid Extremely Bullish 88-Day Structure
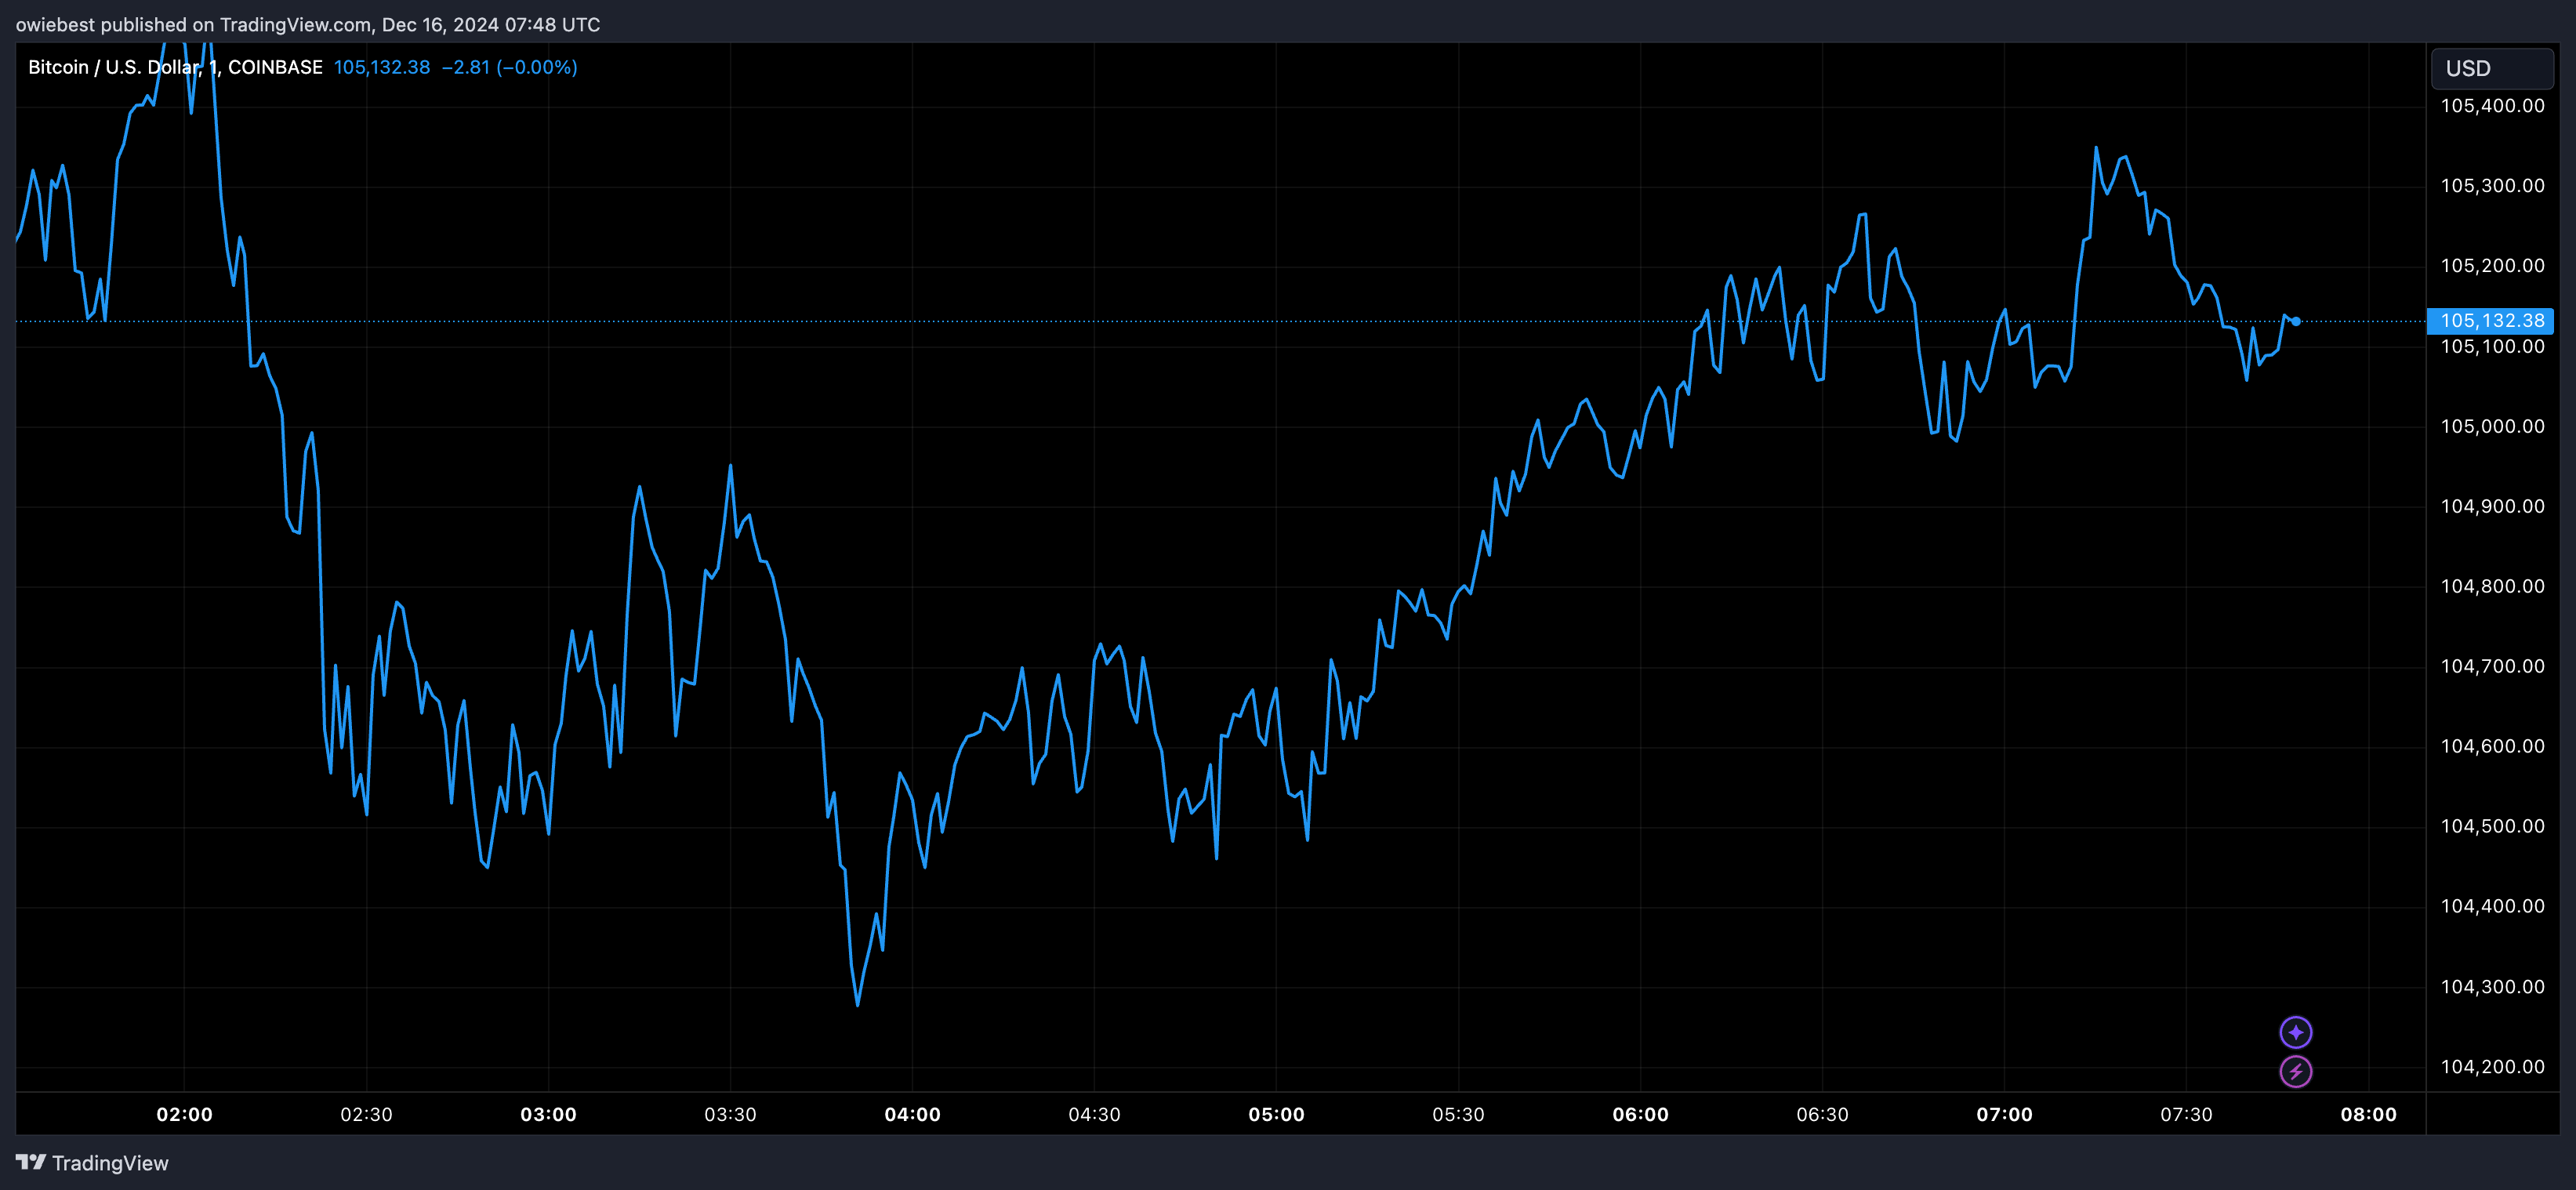
The Bitcoin price has surpassed the $100,000 mark and is currently trading around new all-time highs. Following a surge above $106,000, Bitcoin's price chart indicates an extremely bullish outlook.
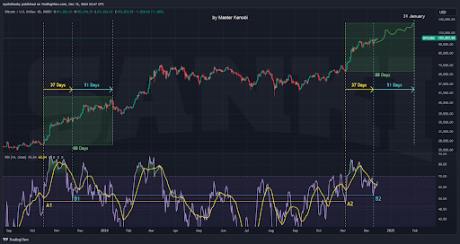
Crypto analyst Master Kenobi noted an 88-day pattern on the Bitcoin price chart, which resembles a similar pattern from late 2023.
88-Day Pattern Resembles Historical Symmetry On Bitcoin Price Chart
Master Kenobi's analysis identifies an 88-day structure mirroring Bitcoin's movements in Q4 2023, prior to the current bull market. The initial 37 days of the current pattern since November 2024 align closely with a hidden distribution phase noted last year. Additionally, both the price action and the daily Relative Strength Index (RSI) indicator exhibit strong similarities.
Kenobi connected key points A1 to A2 and B1 to B2 on the RSI to illustrate the formations' symmetry. He posits that this symmetry suggests Bitcoin’s trajectory may resemble past performance over the next 51 days. While not a precise prediction, it provides a framework for understanding Bitcoin's behavior based on historical data.
Projection Points To $124,300 By Early 2025
Bitcoin's price patterns often repeat. Analyzing historical trends allows analysts to forecast potential outcomes. Expanding his analysis, Kenobi speculated that the upcoming 51-day period could follow a similar path as the previous one, possibly reaching $124,300 by January 31, 2025.
Currently, Bitcoin trades at $105,000, having recently hit an all-time high of $106,352, according to CoinGecko. With a 12% increase this month, reaching the projected target of $124,300 would represent an additional 18% rise. Whether Bitcoin replicates its late 2023 price pattern remains uncertain, but current market sentiment suggests potential growth in 2025.