8 2
Bitcoin Price Momentum Aligns with Rising Global Liquidity Trends
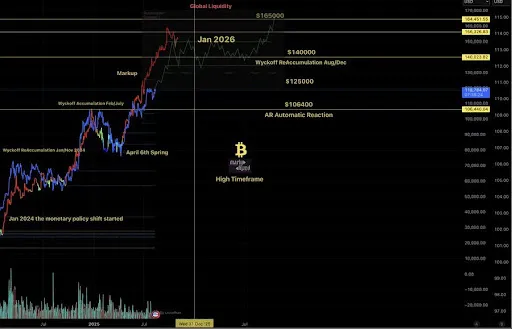
Bitcoin's price movements exhibit a consistent pattern with macroeconomic trends, typically following them with a 12-week delay. Analysts indicate that the current rise in global liquidity may lead to a bullish phase for BTC.
Liquidity Trends and Bitcoin’s Cycle
- BTC price behavior follows global liquidity, with a lag of approximately 12 weeks.
- The global liquidity curve is currently rising, without new US liquidity issuance, indicating external fueling of the surge.
- Potential BTC prices are estimated at $125,000 on foreign liquidity influx and $140,000 driven by it.
- Upcoming US liquidity issuance could start within the next quarter, lasting up to 18 months.
- Expected rate cuts will lower borrowing costs, potentially leading BTC to rally toward $250,000 in the medium to long term.

Since its bottom in 2022, BTC has shown resilience, outperforming the US stock market, with only four corrections between 20% and 30%, resulting in a 420% gain.
Current Energy Value of Bitcoin
- Bitcoin's Energy Value reached an all-time high of $135,000 per BTC.
- This gradual rise reflects a mature market progression, contrasting with past cycles where such peaks led to sharp price declines.
- BTC currently sits about 15% below its Energy Value, suggesting further upward potential.
- Historically, BTC cycle tops occurred when prices surged 40% to 60% above Energy Value.
