Oct 20, 2025
23 1
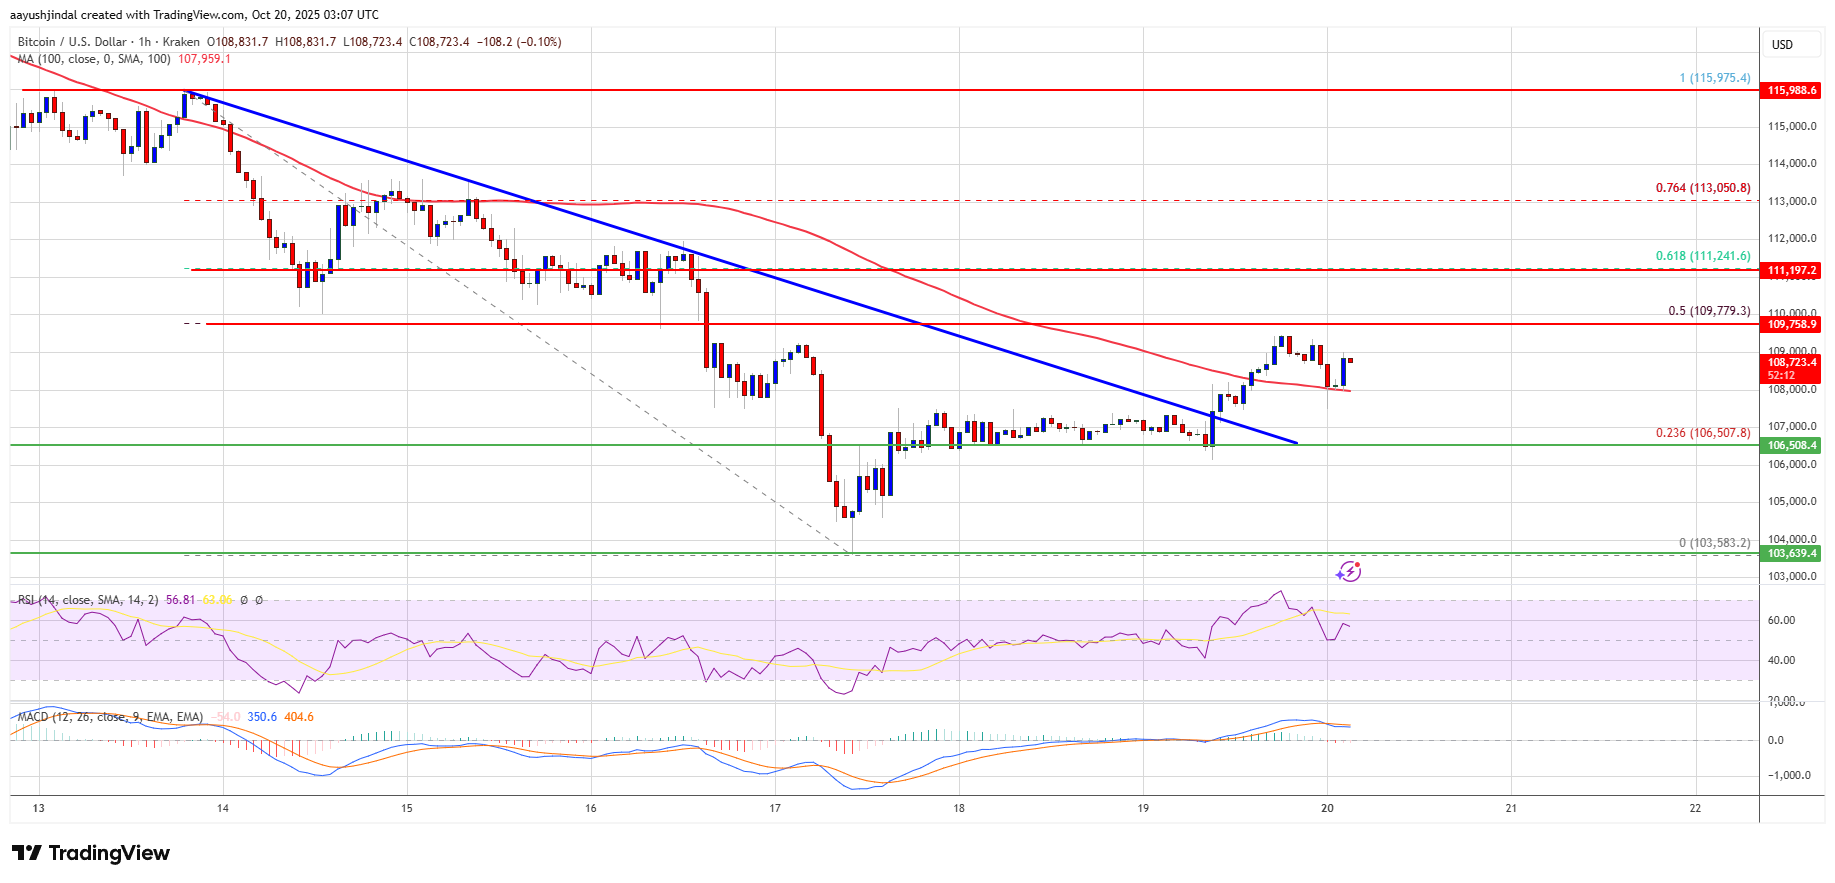
Bitcoin Price Attempts Recovery Above $107,500 Amid Resistance Levels
Bitcoin is attempting a price recovery, trading above $108,000 and the 100 hourly Simple Moving Average.
- A fresh recovery commenced above the $105,000 resistance level.
- BTC broke above a bearish trend line at $107,500 on the BTC/USD hourly chart (Kraken data).
- The immediate resistance levels are at $109,500 and $110,000.
- Further resistance could be at $111,250, aligning with the 61.8% Fibonacci retracement from $115,975 to $103,583.
If Bitcoin surpasses the $111,250 resistance, it could test $112,500. Further gains might lead to $113,200, with a potential rise toward $115,000.
Potential Decline Risks
- If BTC fails to breach the $110,000 resistance, it may decline.
- Key support levels are $108,000 and $107,500.
- Additional support is near $106,200; a fall below this could target $105,500.
- Main support sits at $103,500, critical for short-term recovery.
Technical Indicators:
- Hourly MACD: Bullish momentum is increasing.
- Hourly RSI: Above 50, indicating strength.
- Support Levels: $108,000, $106,500.
- Resistance Levels: $109,500, $111,250.