Oct 21, 2025
10 0
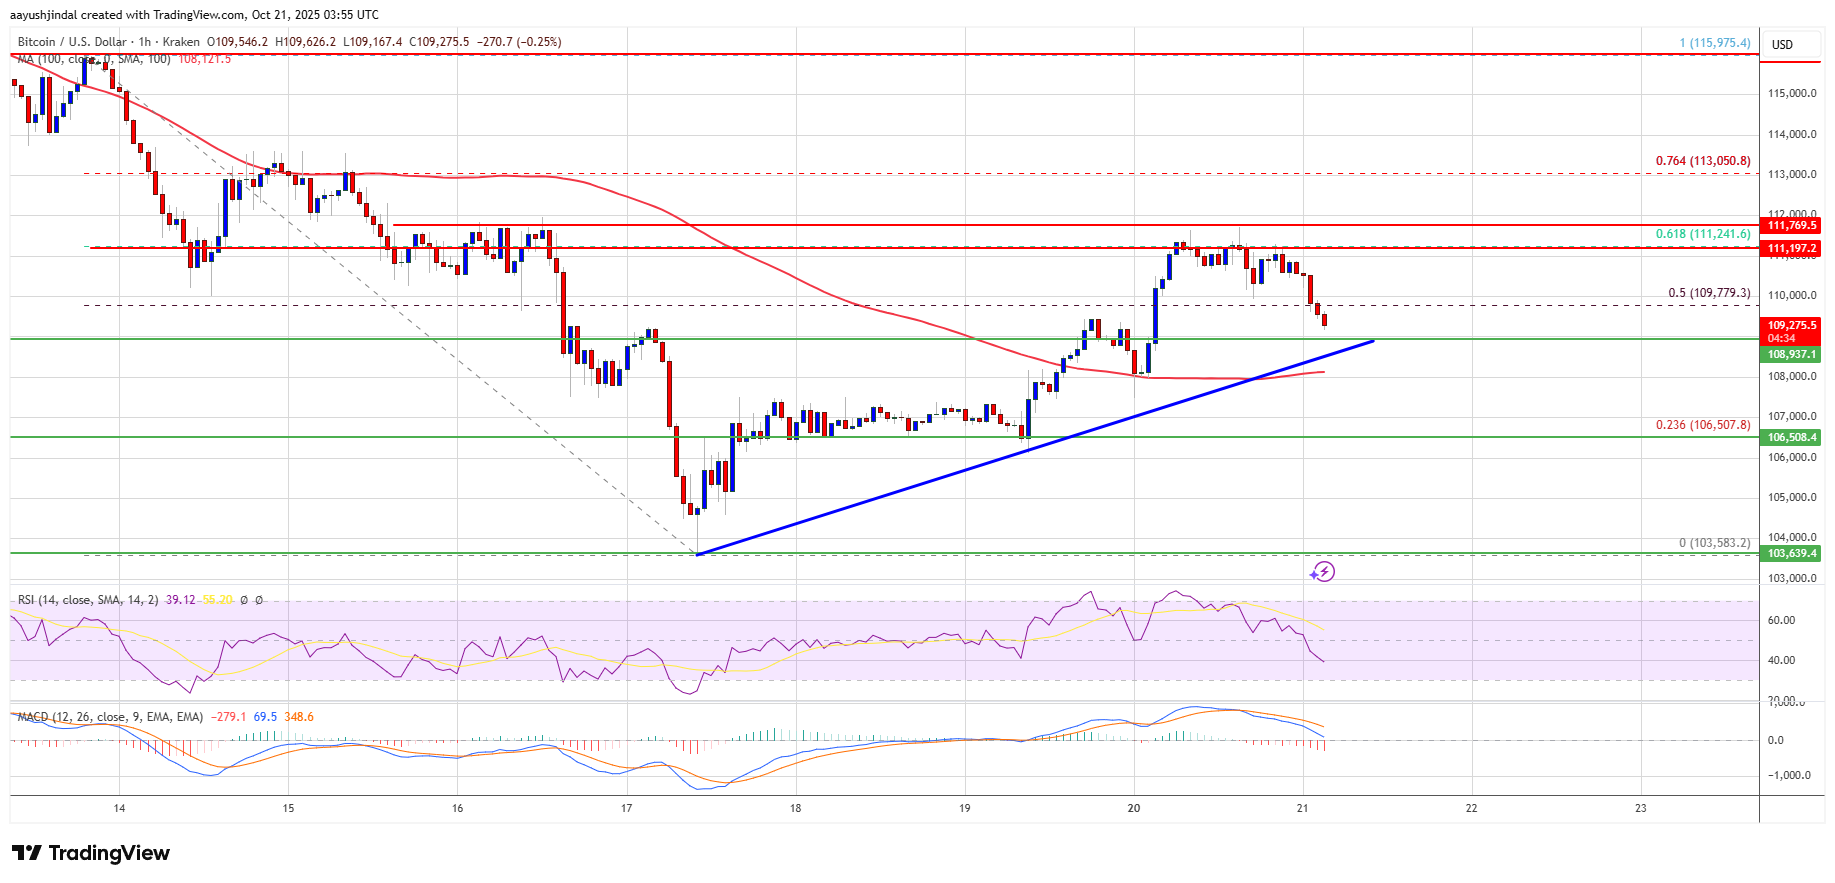
Bitcoin Price Attempts Recovery, Trades Above $109,000 Resistance
Bitcoin Price Overview
- Bitcoin is attempting a recovery above $108,000 and tested $111,800, but is currently trimming gains.
- The price is trading above $108,000 and the 100 hourly Simple Moving Average.
- A bullish trend line supports at $108,800 on the hourly BTC/USD chart.
- The pair may rise if it trades above the $110,500 zone.
Price Movement Details
- Bitcoin started recovering above the $105,500 resistance, surpassing $107,500 and $108,500 levels.
- Bulls pushed the price above $110,500, clearing the 50% Fib retracement of the drop from $115,975 to $103,582.
- The price struggles to stay above $111,500, moving lower from the 61.8% Fib retracement.
- Immediate resistance is near $110,500, with key resistances at $111,200 and $111,500.
- A close above $111,500 could lead to testing $112,500 and potentially $113,200 and $115,000.
Potential for Decline
- If Bitcoin fails to rise above $110,000, a decline might start.
- Immediate support is near $108,800 and the trend line, with major support at $108,000.
- Further support levels are at $107,550, $106,500, and main support at $105,500.
Technical Indicators
- Hourly MACD: Gaining pace in the bearish zone.
- Hourly RSI: Below the 50 level.
- Major Support Levels: $108,800, $108,000.
- Major Resistance Levels: $110,500, $111,500.