May 9, 2025
12 1
Bitcoin Price Signals Potential for Significant Rally Toward New All-Time High
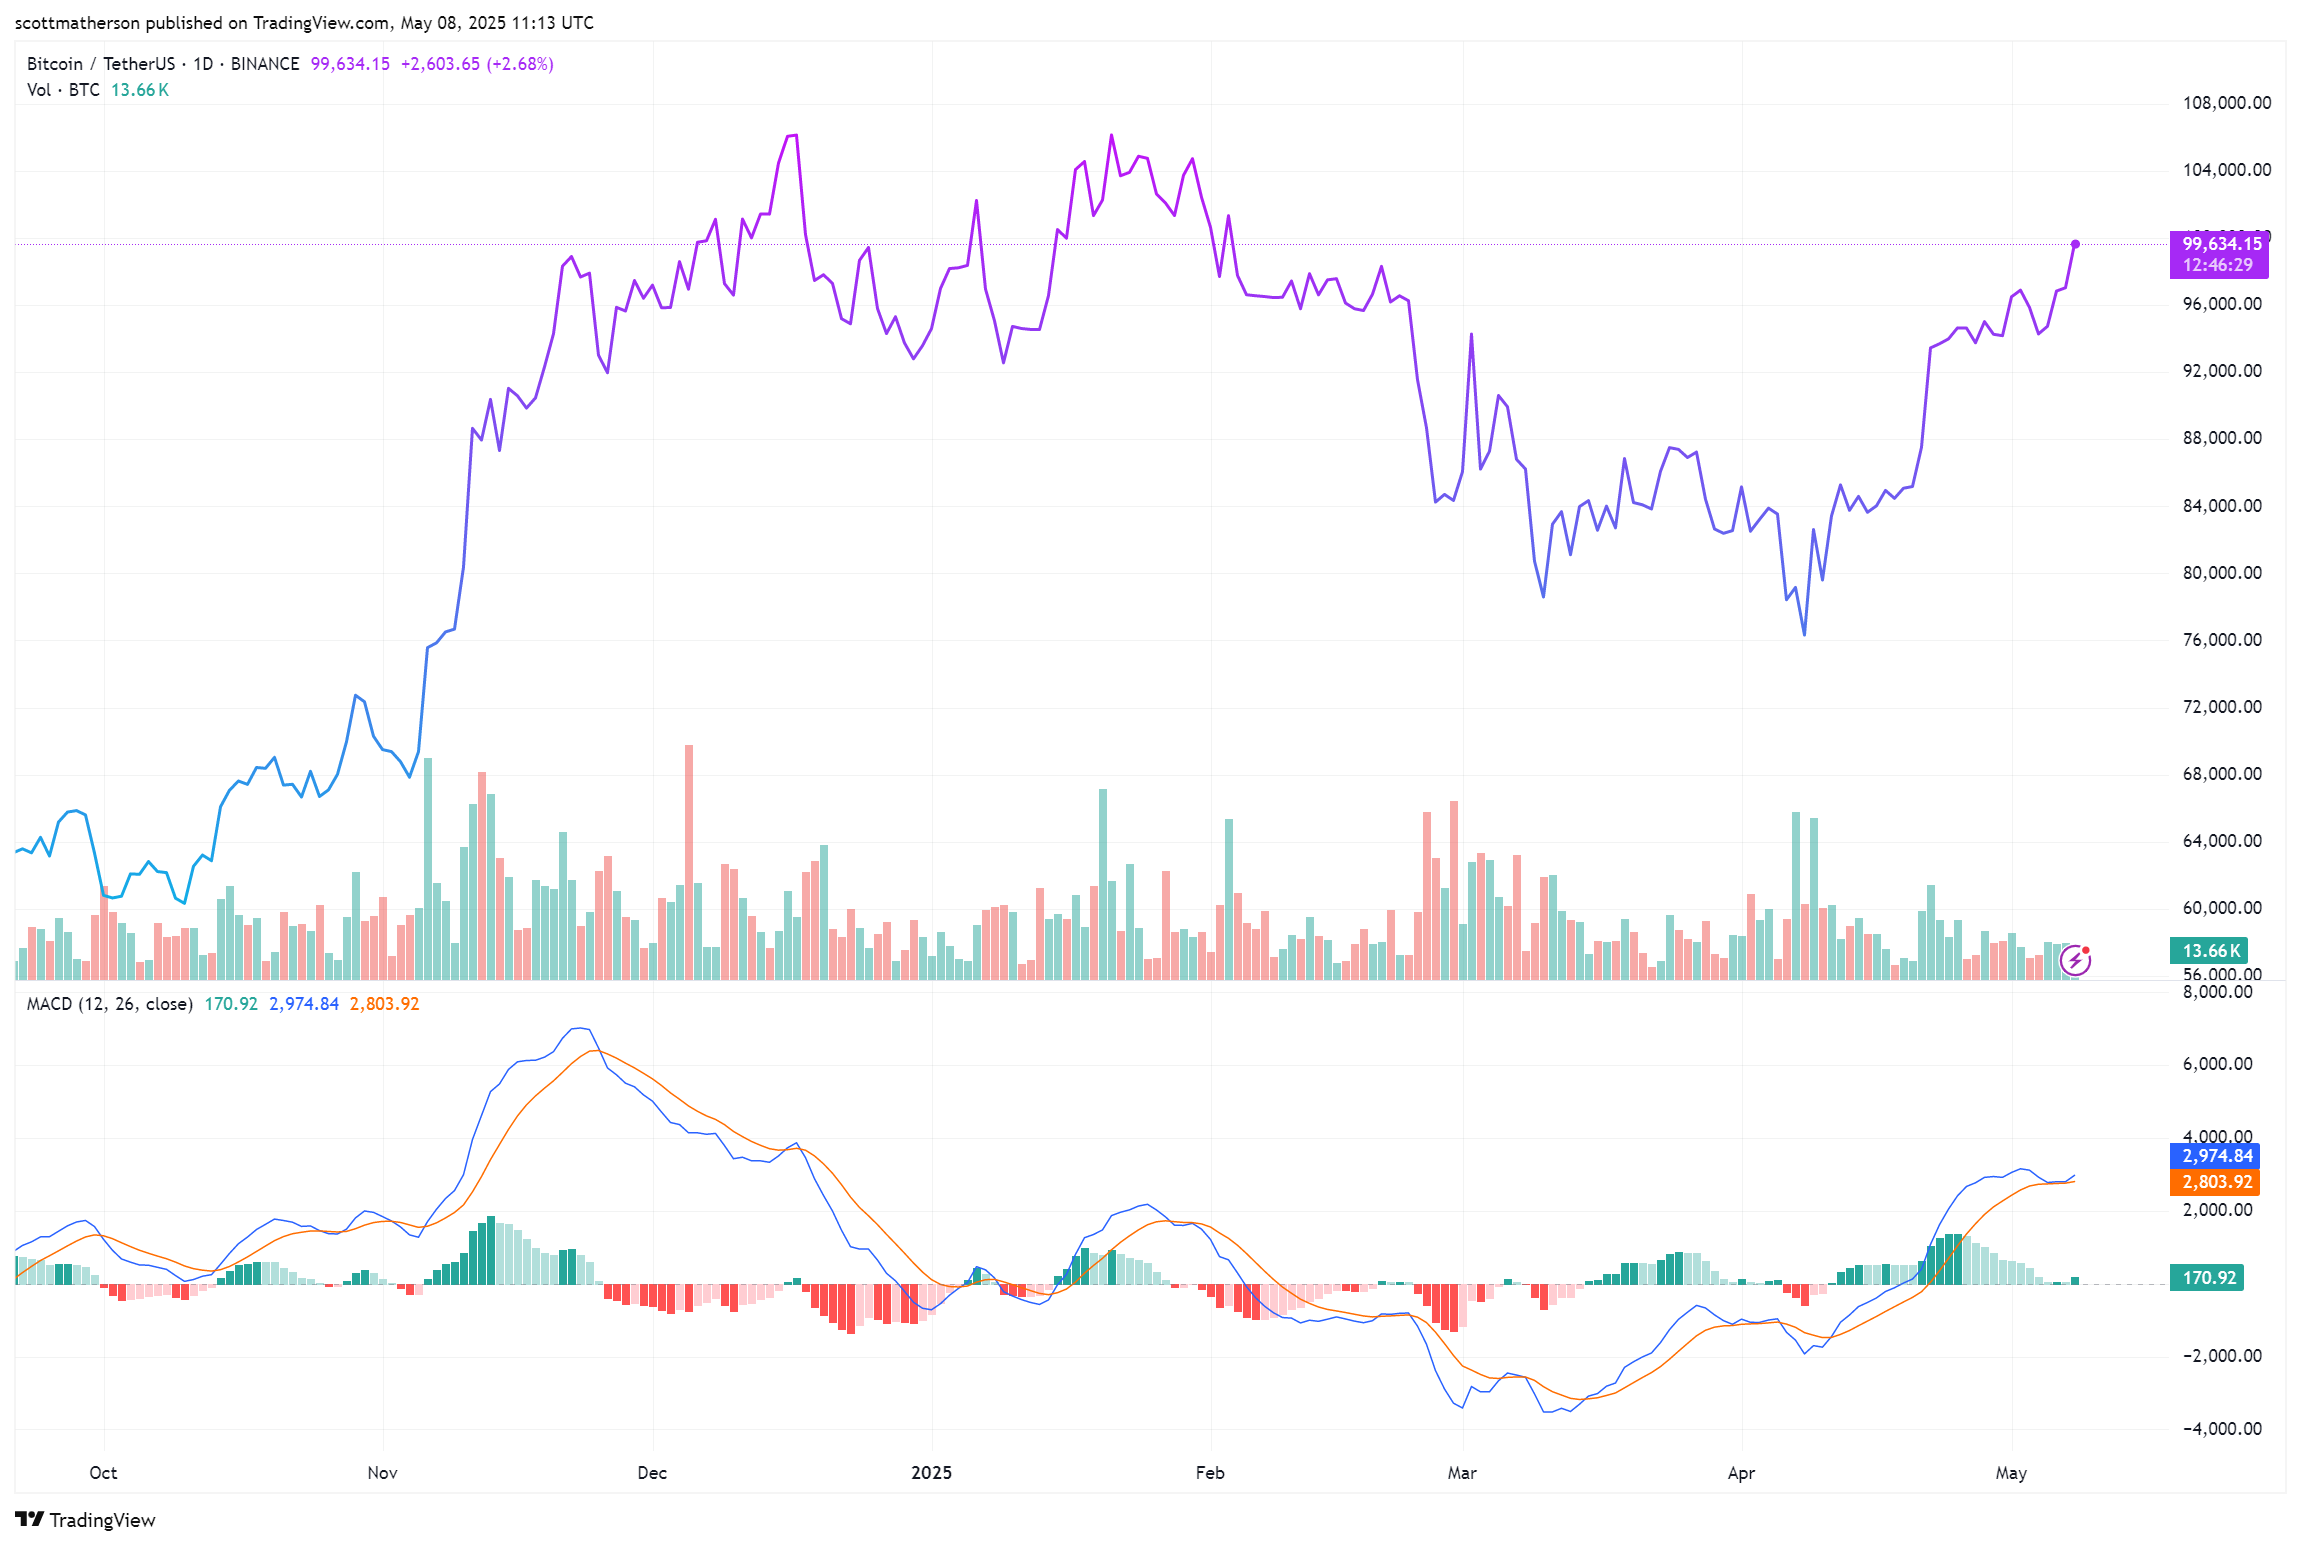
The Bitcoin price is experiencing a significant surge, having increased 4.75% recently and approaching the $100,000 mark. Analysts are noting bullish signals that historically precede major rallies.
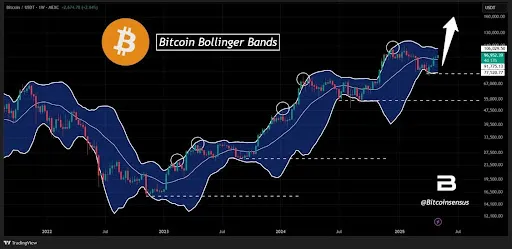
Bollinger Band Signal Overview
- Bitcoin's weekly chart shows a critical pattern identified by Bollinger Bands, appearing four times since 2022.
- This signal indicates potential upward movement in Bitcoin's price and confirms a support level around $77,500.
- Past occurrences of this signal led to price increases from below $2,000 to over $30,000, above $45,000, past $60,000, and a recent run above $100,000.
- Current predictions suggest a price rally towards $130,000 - $160,000, potentially exceeding the all-time high of $109,000.
Price Breakout Analysis
- Trader Tardigrade predicts a breakout from a descending trendline resistance, similar to patterns seen previously.
- Historical breakouts occurred in late 2022 to early 2023, mid-2023 to early 2024, and late 2024 to early 2025.
- Current analysis suggests a target zone between $100,000 - $136,000 for Bitcoin.