Crypto Commentator Predicts Bitcoin Price Surge to $225k Soon
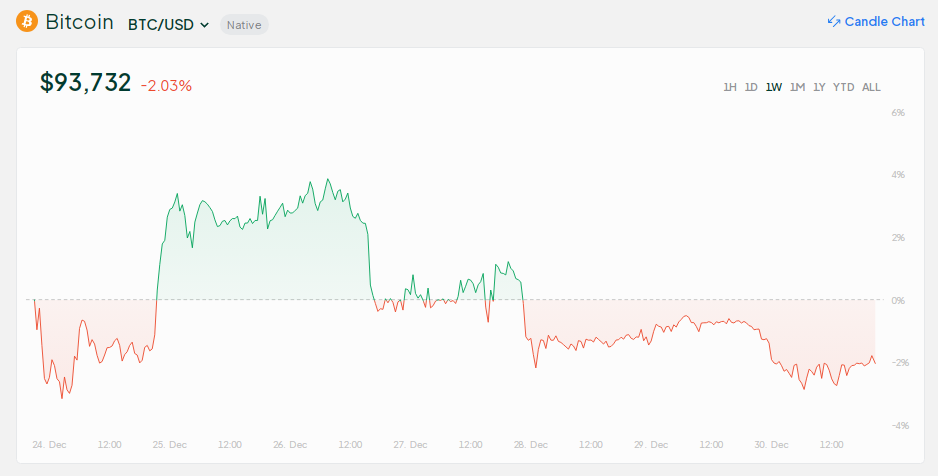
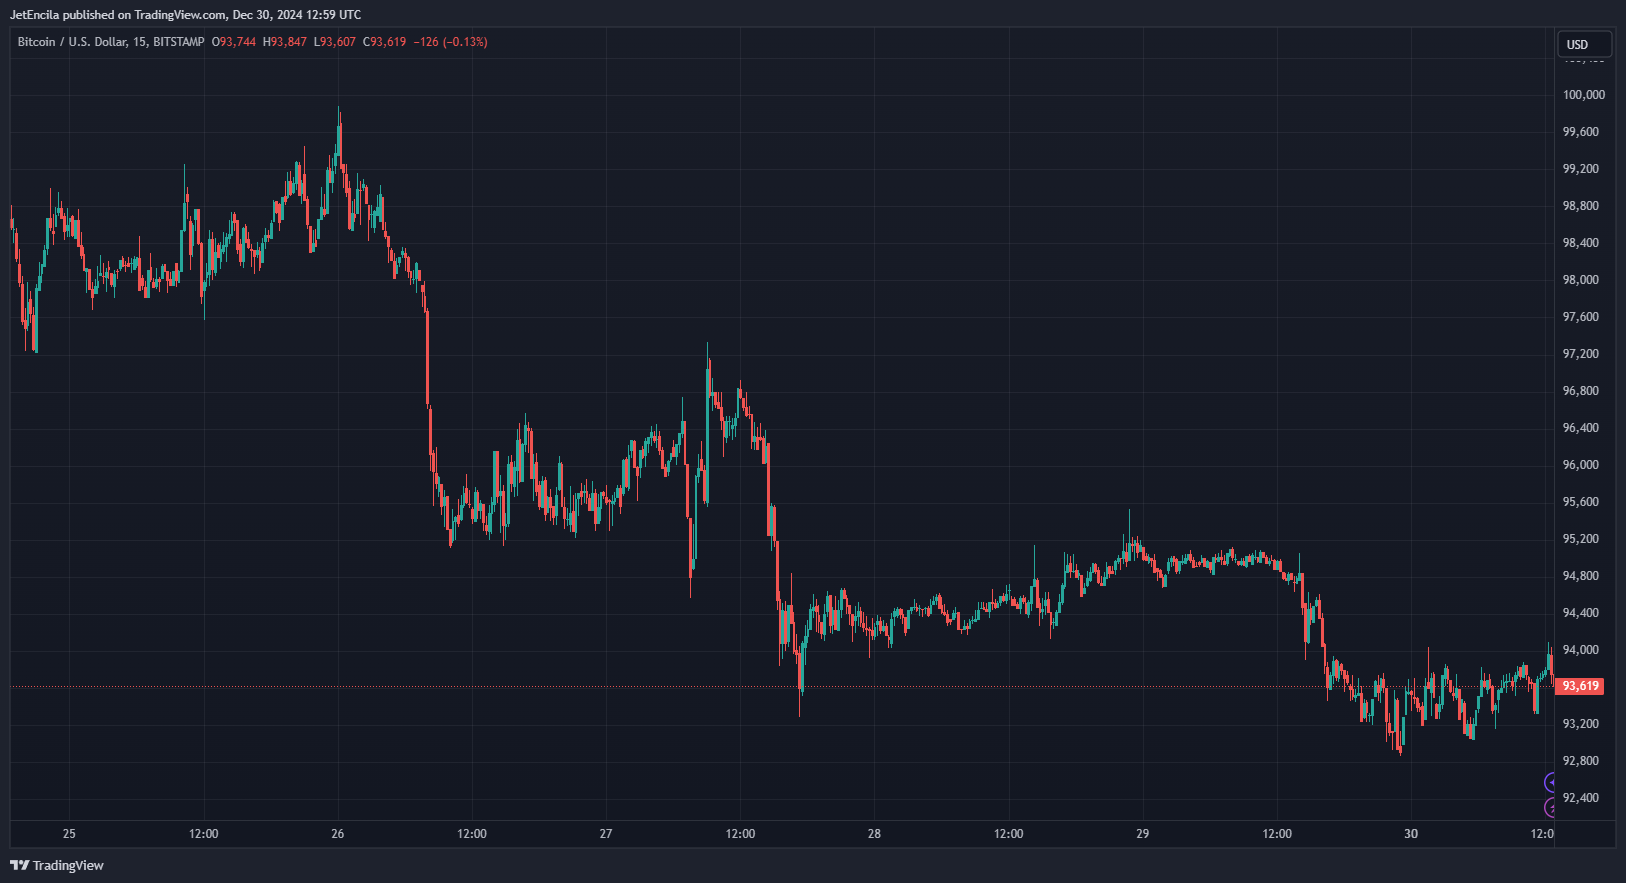
Bitcoin's current price ranges between $93k and $96k. Analyst Ted Boydston predicts a significant price surge, targeting $225k soon.
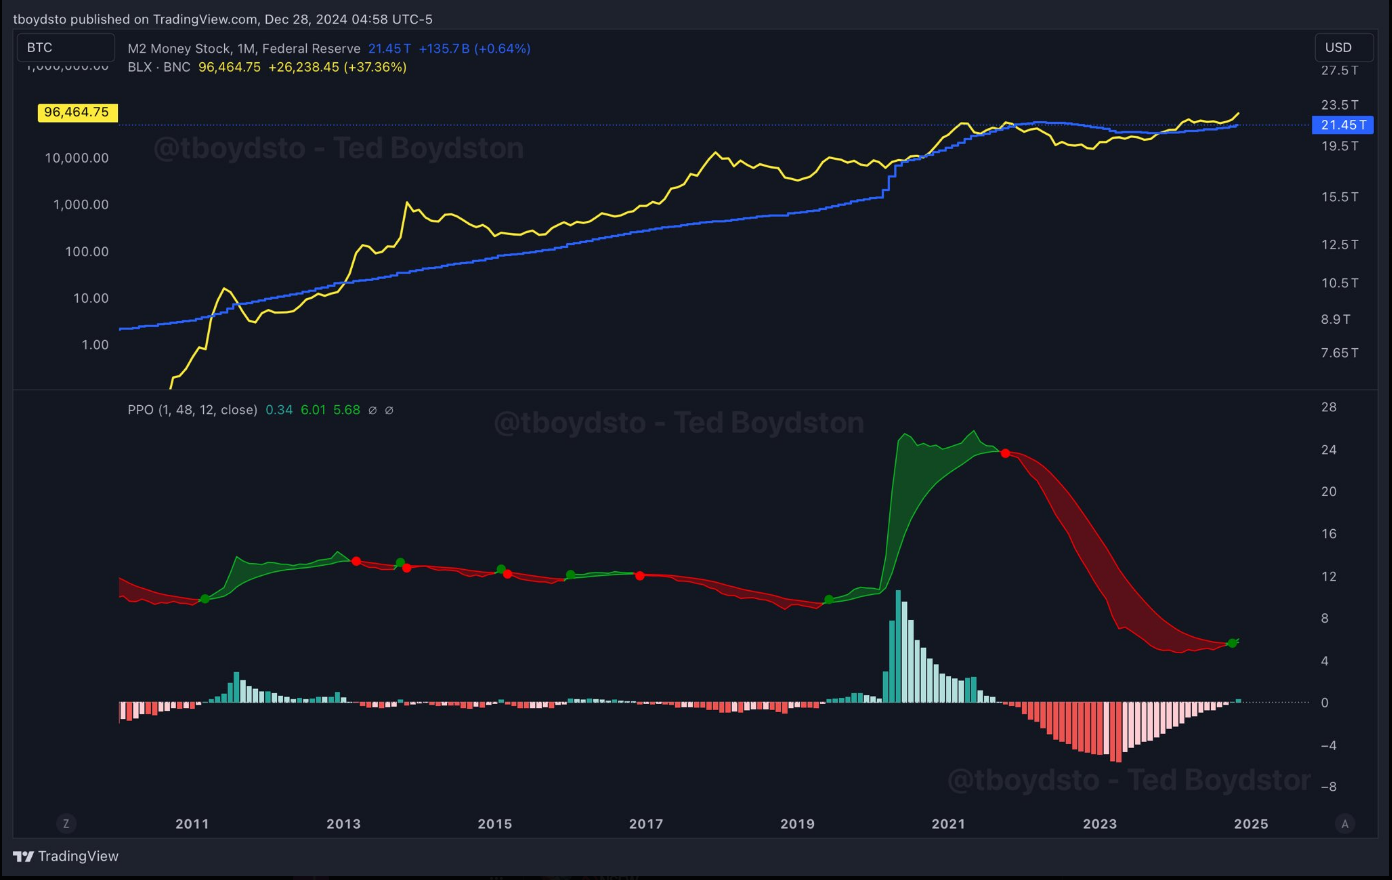
Boydston refers to the M2 price oscillator, which provides real-time buy and sell signals. Recently, it indicated a buy signal, suggesting that Bitcoin may experience a price increase, benefiting investors.
Bitcoin And Its M2 Price Oscillator Chart
Boydston emphasizes the M2 price oscillator's reliability in previous cycles, noting a recent buy signal. Historical patterns suggest this could lead to a bullish phase for Bitcoin.
Except for the 2016 Bitcoin cycle, a price oscillator on M2 has provided well timed buy and sell signals.
The oscillator recently flashed a buy. If history rhymes, this means money printing and Bitcoin’s manic phase should start soon. pic.twitter.com/61RpHYudIw
— Ted Boydston (@tboydsto) December 28, 2024
The M2 money stock encompasses liquid cash circulation, providing insights into asset performance potential.
This technical analysis has historically aided traders in anticipating market movements.
A Bitcoin Bull Run Soon?
The M2 oscillator chart shows a shift from red to a potential buy signal as the year concludes, indicating possible upward momentum for Bitcoin.
Bitcoin’s M2 price oscillator is flashing a BUY signal!
With the exception of the 2016 Bitcoin cycle, this indicator has an insane accuracy.
If history repeats, this could signal the start of money printing and another major BTC pump.
Ignore it at your own risk! pic.twitter.com/zsepPXjLH0
— BitcoinHyper (@BitcoinHypers) December 28, 2024
Boydston argues that such signals typically precede price surges, potentially leading to increased volatility and appreciation in Bitcoin's value.
Bitcoin’s Future Price Action
Analysts previously targeted $100k for Bitcoin, which was reached in December. Current predictions include short-term targets of $150k and some speculating up to $1 million.
Boydston's $225k prediction aligns with historical Fibonacci retracement levels during bullish phases.
Featured image from Getty Images, chart from TradingView