Bitcoin Price Surges to $93,250 Before Pullback to $88,800
Bitcoin (BTC) has surged over 39% since November 5th, reaching a record high of $93,250 before pulling back to approximately $88,800. Market analyst Quinten Francois suggests further retracement may occur, potentially dropping below $80,000 due to a significant CME gap beneath this level.
12% Retracement Ahead?
CME gaps represent price discrepancies on the Chicago Mercantile Exchange Bitcoin futures chart, where daily closing and opening prices differ. These gaps often fill as markets stabilize after substantial price movements.
Francois identified a CME gap at the $78,000 level, indicating a potential retracement of over 12% from current prices if filled soon.
A correction could be beneficial for BTC, liquidating long positions and allowing future upward movements. Historical patterns show that such pullbacks can provide necessary liquidity for further advances. Should selling pressure increase, additional support levels are noted at $72,000 and $69,000. A drop below these levels would revert BTC to pre-November 5th prices, linked to Donald Trump’s election victory, which many consider a catalyst for the recent surge.
Could Trump’s Bitcoin Strategy Influence Future Price Movements?
During his presidential campaign, Trump expressed intentions to support digital asset growth, positioning Bitcoin as central to his economic policy.
One of Trump’s promises includes establishing Bitcoin as a strategic reserve asset for the United States.
Pro-crypto Senator Cynthia Lummis has introduced the Bitcoin Act in the Senate, aiming to increase US Bitcoin reserves to 1 million coins, potentially reducing market supply and positively impacting BTC price.
Francois predicts a bear market for the broader cryptocurrency sector between 2026 and 2027, suggesting an extended bull run for Bitcoin and the digital asset ecosystem in the next two years. He cautioned that if the $78,000 CME gap is not filled before a significant rally, it may need addressing in the subsequent bear market phase, indicating further price fluctuations ahead.
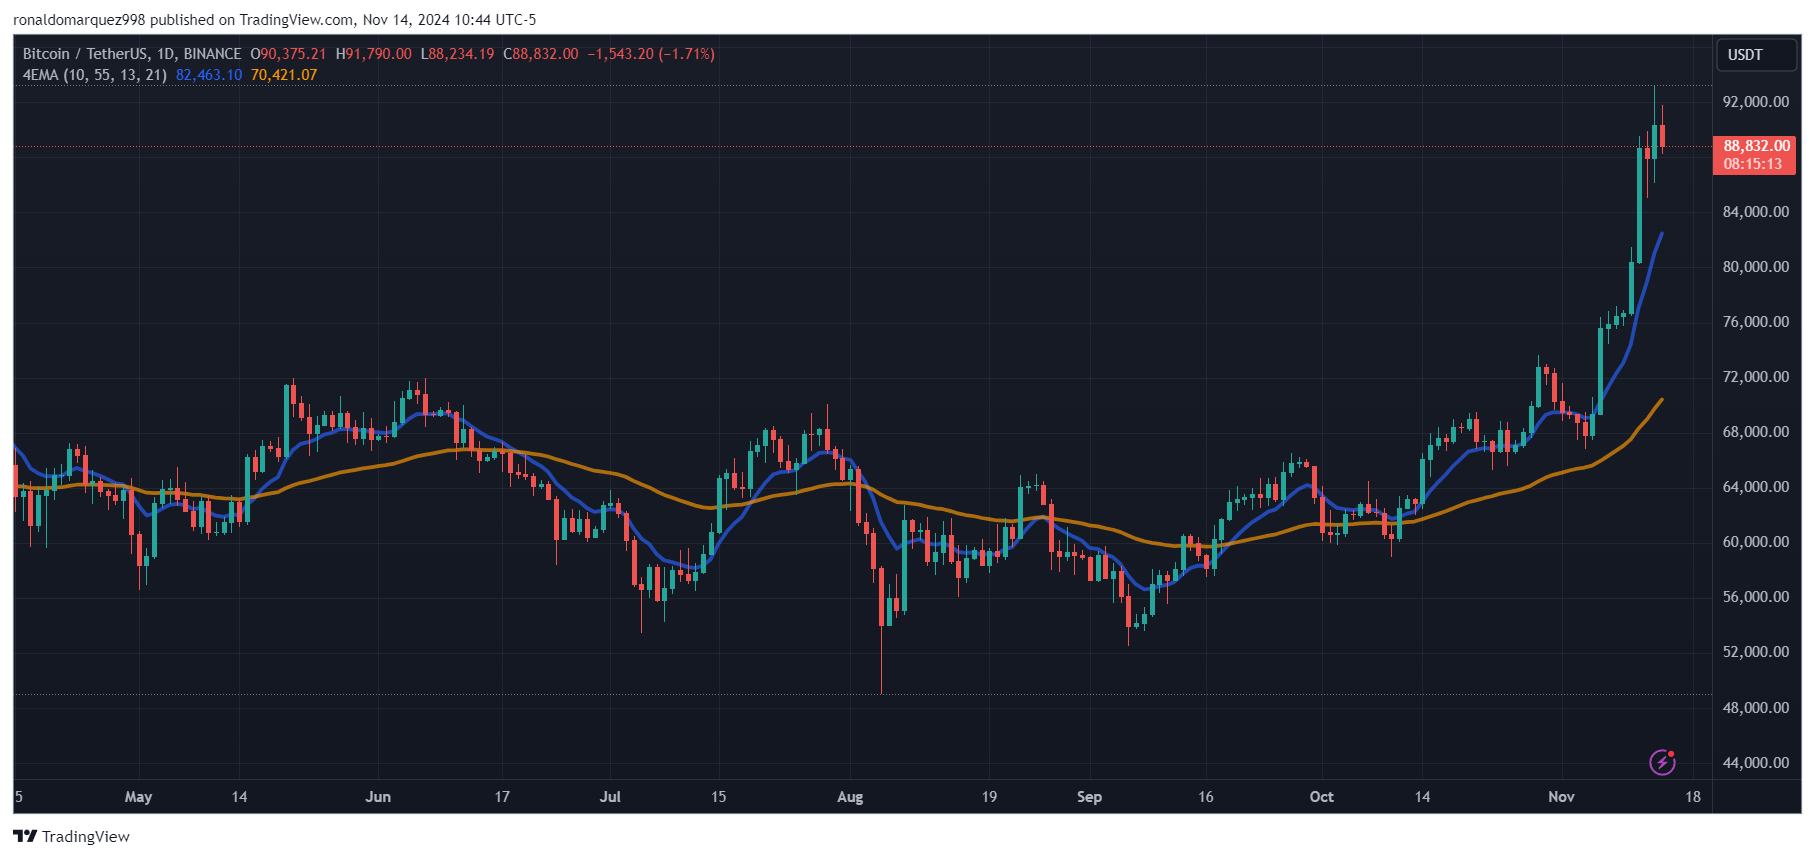
Featured image from DALL-E, chart from TradingView.com