Bitcoin Price Surges to $98,000, Enters Parabolic Phase According to Analyst
The Bitcoin price has consistently tested resistance levels above $95,000 as it aims to reach the anticipated $100,000 all-time high. Following a surge to $98,000, crypto analyst Rekt Capital stated that BTC has officially entered the parabolic phase of this four-year market cycle.
Bitcoin Price Enters Parabolic Phase
Analyst Rekt Capital informed his 517,800 followers on X (formerly Twitter) that Bitcoin has transitioned into its “Parabolic Upside phase” during this bull cycle. He shared a chart showing the coin's price action in both the 2021 bull run and the current cycle.
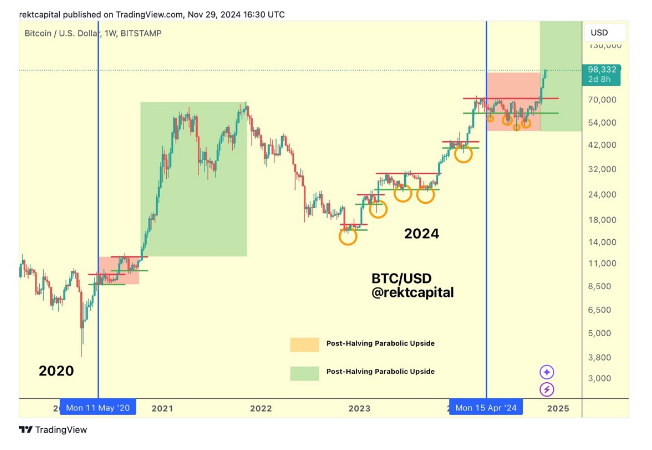
Post-halving in 2022, Bitcoin experienced a significant rally to over $64,000 before a correction. A similar pattern is emerging in the current cycle, indicating potential for further price rallies. Recently, BTC entered a re-accumulation phase, marked by slight declines and consolidation prior to a rally above $99,000.
Rekt Capital noted that after reaching $98,000, Bitcoin successfully entered its parabolic upside phase, suggesting further increases are possible. On November 27, he illustrated Bitcoin's progression into this phase, indicating it was exiting a reaccumulation phase as shown on the price chart.
Bitcoin Price: $100,000 ATH - Now Or Never
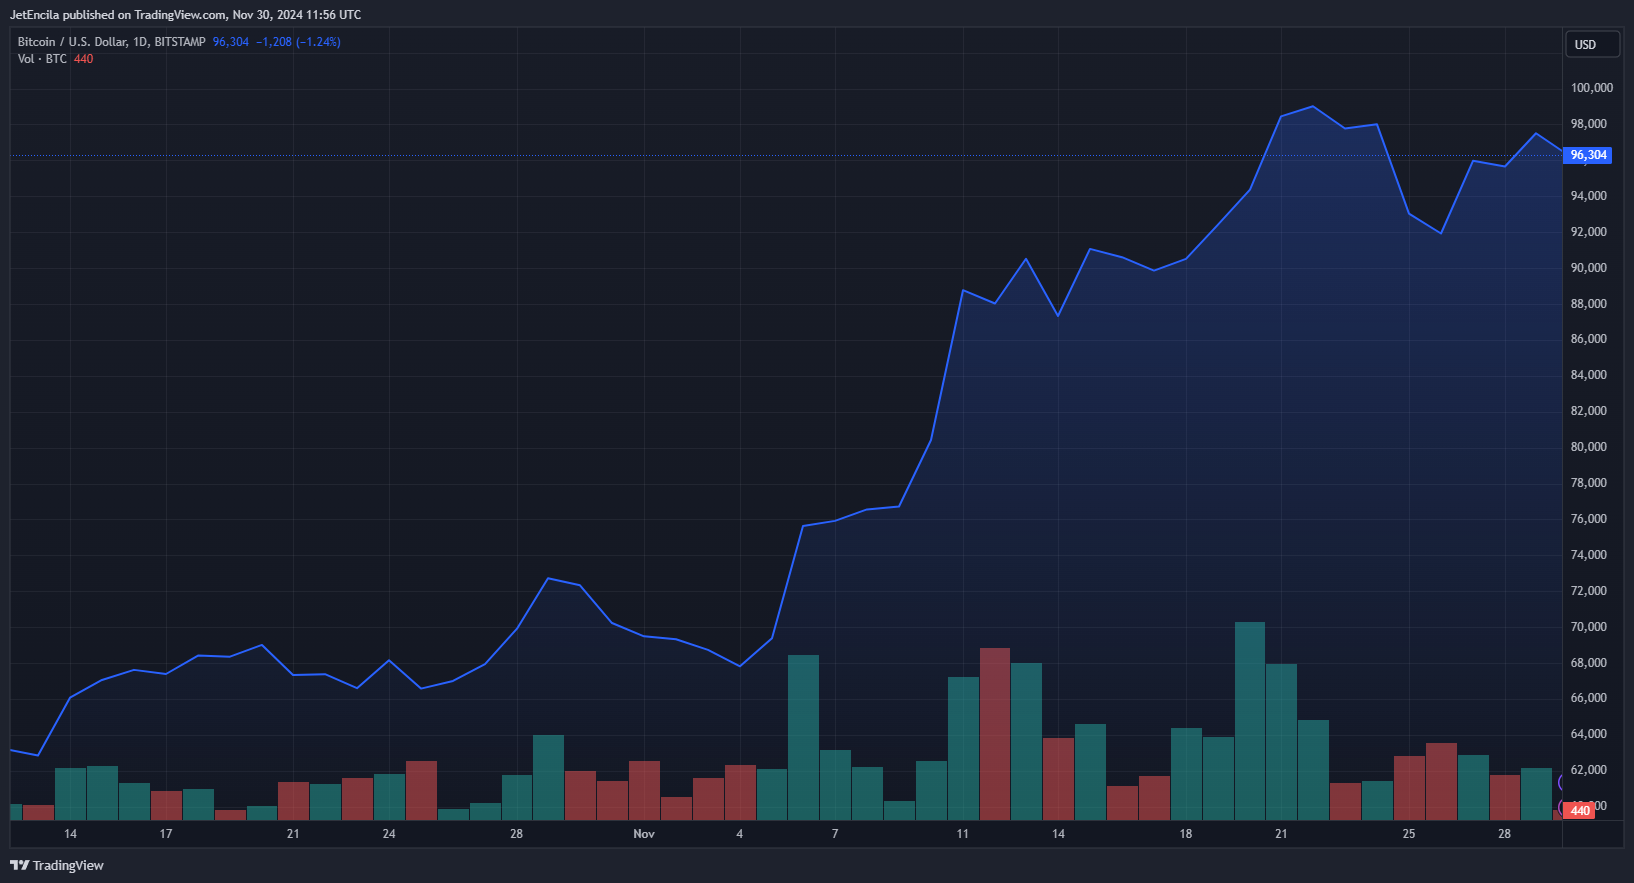
The crypto community anticipates a surge to $100,000, with Bitcoin trading just below this mark after briefly exceeding $98,000 in recent days. Analysts highlight the urgency for Bitcoin to achieve this milestone during the current cycle.
Trader of Crypto noted the strong bullish trend, stating that “the clock is ticking” for Bitcoin to reach $100,000. This reflects the cryptocurrency's proximity to this milestone.
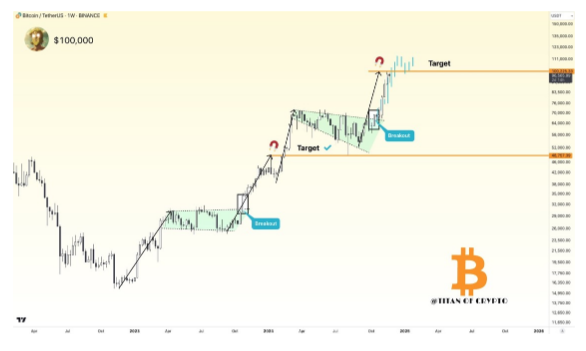
While maintaining a bullish outlook, Trader of Crypto also presented a price chart suggesting that Bitcoin could fall to $46,757 if bearish momentum takes over.
The Bitcoin price is currently trading at $96,965, reflecting a 1% increase over the past 24 hours, according to CoinMarketCap.
Featured image from Pexels, chart from TradingView