Bitcoin Attempts Recovery Above $108,800 Amid Upward Momentum
Bitcoin's price is showing signs of recovery, attempting to rise above crucial resistance levels.
- BTC started a recovery wave, surpassing the $108,800 resistance.
- The price is trading above $109,000 and the 100 hourly Simple Moving Average (SMA).
- A break occurred above a short-term channel with resistance at $108,700 on the hourly BTC/USD chart from Kraken.
- The pair may continue upward if it breaks past the $111,200 resistance zone.
Price Movement Analysis
Bitcoin initially dropped below $109,000, testing the $106,720 area. It then rebounded, moving past the $108,800 resistance.
The price exceeded the 50% Fibonacci retracement level from the $114,000 high to the $106,717 low. Key immediate resistance lies at $111,200, coinciding with the 61.8% Fibonacci level.
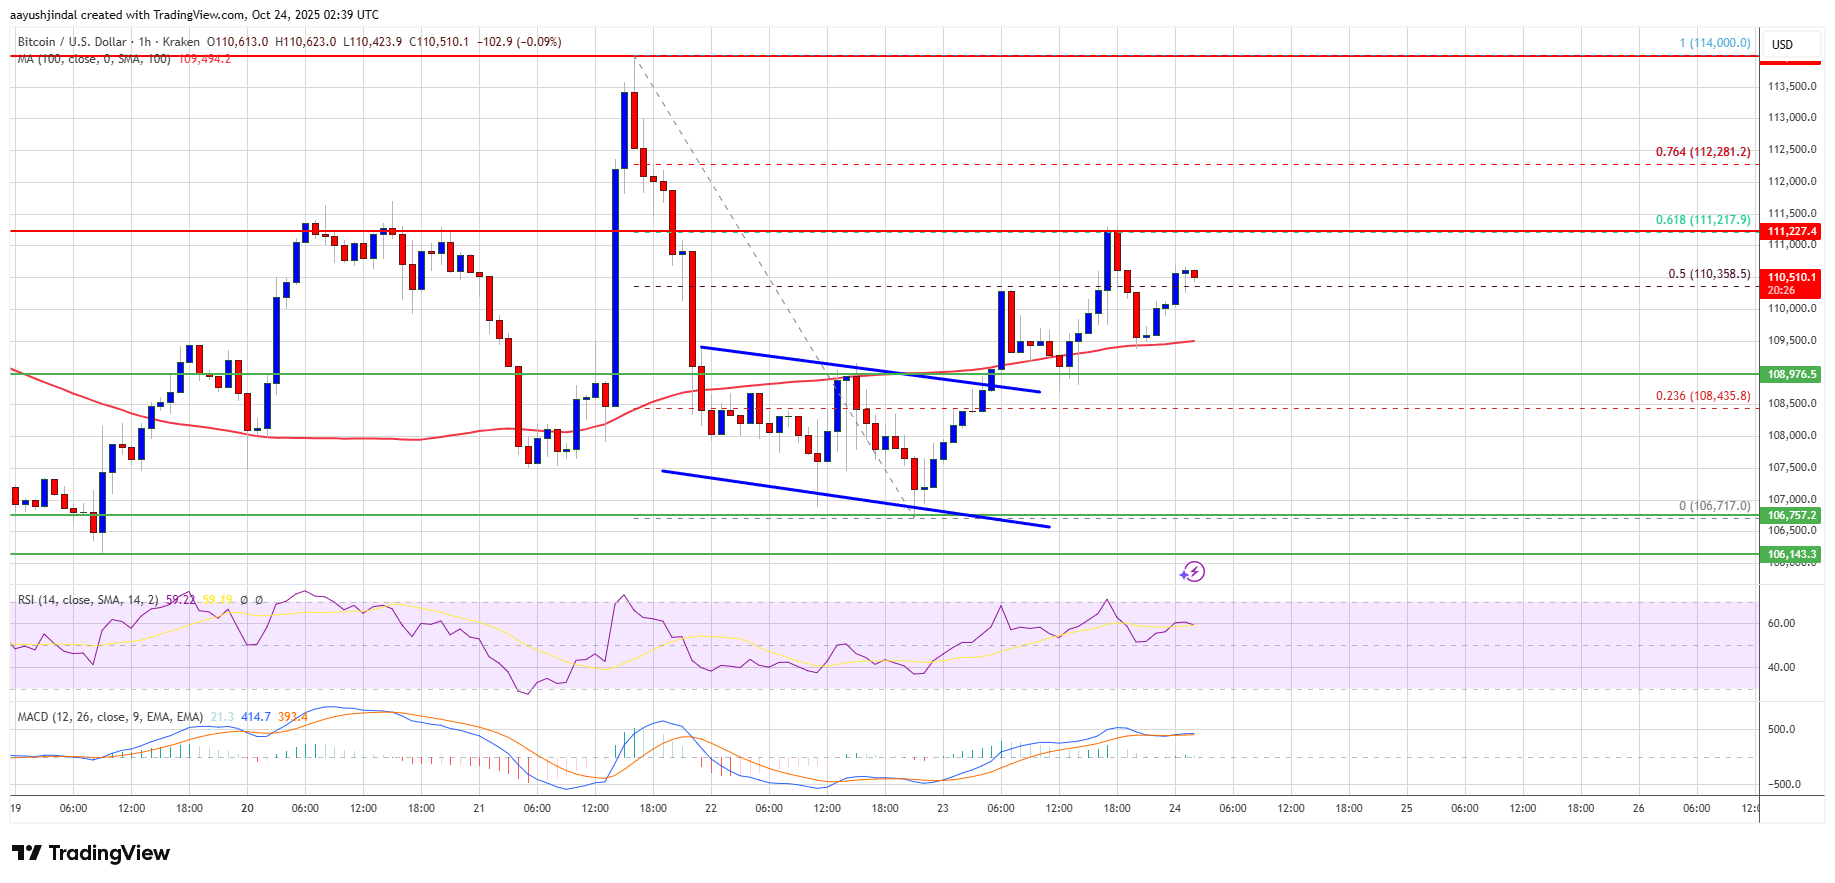
Further resistance levels are at $111,500 and $112,500. A close above $112,500 could propel BTC toward $113,200 and potentially $115,500.
Potential for Decline
If BTC fails to surpass the $111,200 resistance, a decline might ensue. Initial support is around $109,500, with major support at $108,800.
Subsequent support levels include $108,500 and $107,400. Critical support resides at $106,500, below which recovery may be challenging.
Technical Indicators:
- Hourly MACD: Bullish momentum is increasing.
- Hourly RSI: Currently above the 50 mark, indicating potential strength.
- Support Levels: $109,500 and $108,800.
- Resistance Levels: $111,200 and $112,500.