Dec 2, 2025
8 0
Bitcoin Faces Resistance at $88,000 Amid Recovery Attempt
Bitcoin Price Movement
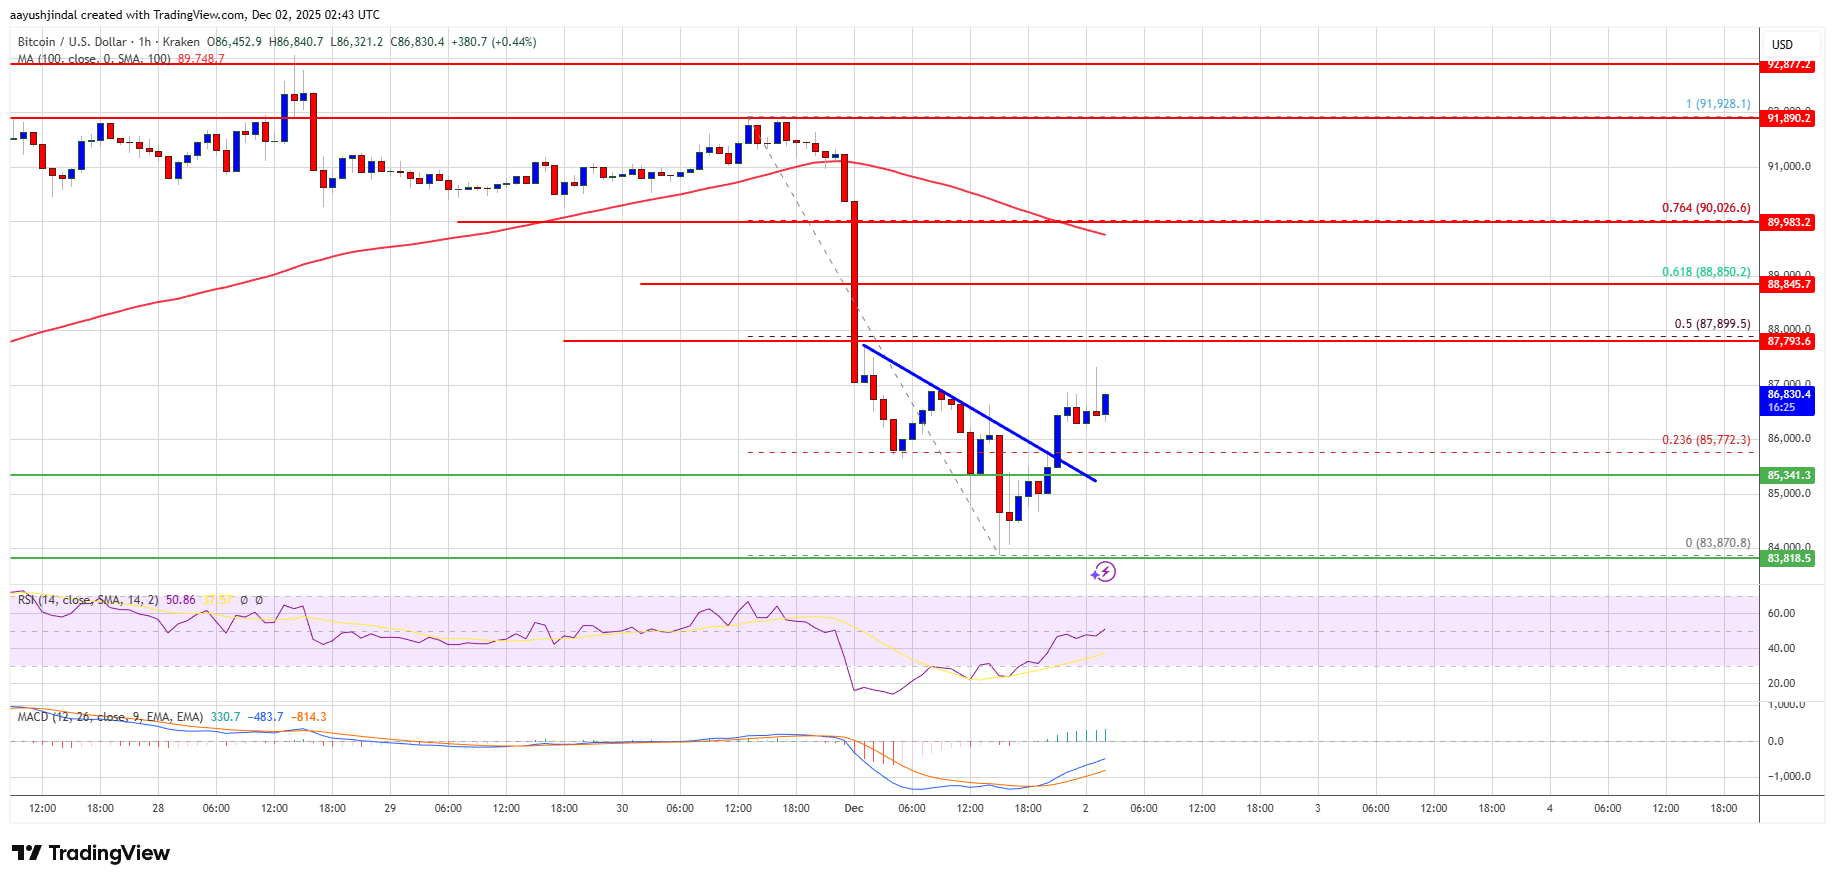
- Bitcoin's price declined below $88,000 and is trading below $87,500 and the 100 hourly SMA.
- There was a break above a short-term bearish trend line with resistance at $86,000 on the BTC/USD hourly chart.
- The price might continue to decline if it settles below the $85,500 zone.
Current Recovery Attempt
- After failing to maintain above $90,000, Bitcoin dropped sharply below $88,500 and $88,000.
- A low was formed at $83,870, and the price is now correcting losses.
- The price surpassed the 23.6% Fib retracement level of the recent decline.
- Immediate resistance is near $87,250, with key resistance at $88,000 or the 50% Fib level.
- Next resistance targets are $88,500, $90,000, $91,500, $92,000, and $92,500.
Potential Downward Movement
- If Bitcoin fails to surpass $88,000, another decline may occur.
- Immediate support is at $85,500, with major supports at $85,000 and $83,500.
- Further losses could push the price toward $82,500 and possibly $81,200.
Technical Indicators
- Hourly MACD: Losing pace in the bearish zone.
- Hourly RSI: Above the 50 level for BTC/USD.
Support and Resistance Levels
- Major Support: $85,500, then $85,000.
- Major Resistance: $87,250 and $88,000.