Nov 25, 2025
3 0
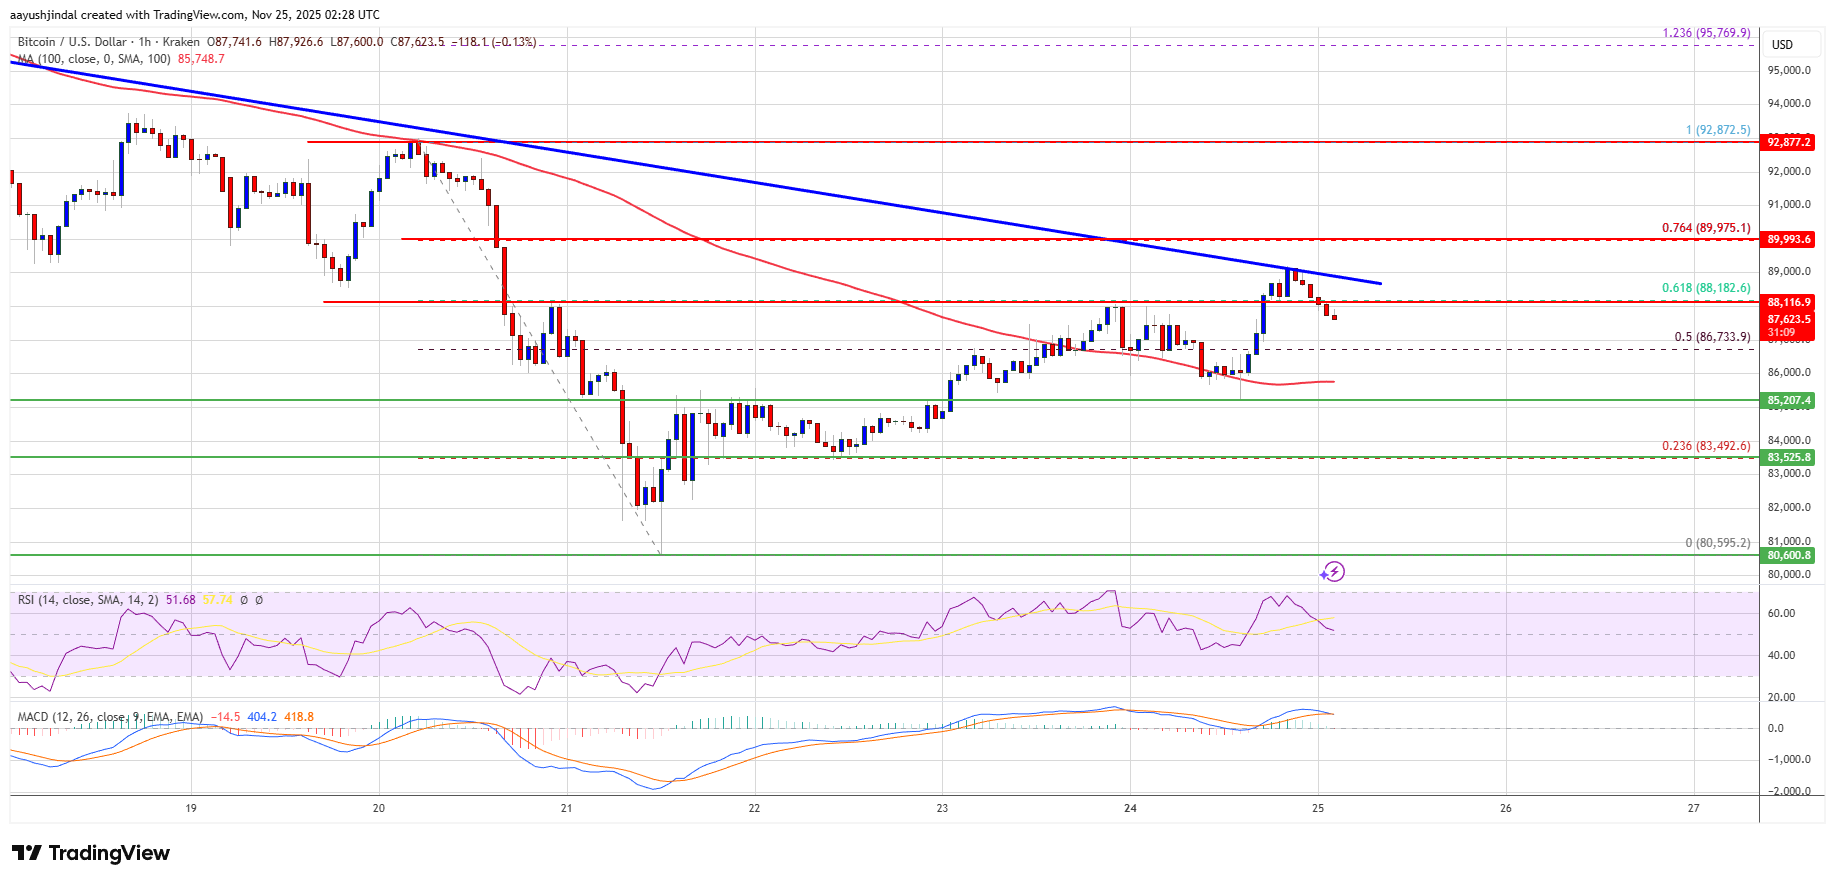
Bitcoin Faces Resistance Near $89,000 Amid Recovery Efforts
Bitcoin Price Analysis
- Bitcoin price initiated a recovery wave, reaching towards $89,000.
- Currently trades above $86,000 and the 100 hourly SMA.
- A bearish trend line is forming with resistance at $89,000 on the BTC/USD chart.
- Potential continuation of downward movement if the price falls below $86,000.
Resistance Levels
After maintaining above $82,000, Bitcoin began recovering past the $85,000 resistance. It surpassed the $86,500 resistance, but faces strong resistance near:
- $88,500
- $89,000 (trend line)
- $90,000 or the 76.4% Fib retracement
If BTC closes above $90,000, potential targets include:
- $92,500
- $93,200
- Further resistance at $94,500 and $95,000
Potential Decline
Failure to surpass $89,000 may lead to another decline. Key support levels include:
- $86,750 (immediate support)
- $86,000 (major support)
- $83,500
- Further losses could target $82,500 and $80,000
Technical Indicators:
- Hourly MACD: Losing momentum in the bullish zone.
- Hourly RSI: Above 50 level for BTC/USD.