Jan 25, 2026
6 0
Bitcoin Faces Resistance at $91,000 Amid Historical Pattern Concerns
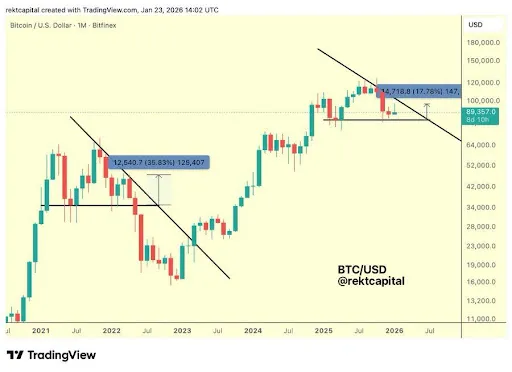
Bitcoin's price is showing patterns similar to those seen in 2021, with key resistance near $91,000–$92,000 and a macro downtrend looming. Traders are monitoring whether BTC will break higher or face renewed pressure, as the coming days could be decisive for its next major move.
Key Observations:
- Current market structure echoes historical behavior from the 2021 cluster, suggesting similar dynamics are at play.
- A bearish trend would likely occur if Bitcoin breaks down from the macro descending triangle base around $82,000.
- A bullish trend requires a decisive break above the macro downtrend near $100,000.
Recently, Bitcoin encountered rejection in the high $90,000s, mirroring previous market behavior. This suggests consolidation and preparation for the next directional move. If the macro downtrend remains resistant, there is an increased risk of further downside.
Recent Market Update:
- Bitcoin surpassed $91,000 but faced significant selling pressure, capping momentum and preventing a sustained breakout.
- BTC retreated into a "no-trading zone," with sideways price action expected to persist due to low weekend liquidity.
- Any upward movement needs strong spot demand to clear the $91,000 to $92,000 resistance zone decisively.