Nov 6, 2025
9 0
Bitcoin Struggles Below $104,000 as Resistance Levels Persist
Bitcoin Price Analysis
- Bitcoin's price is facing a decline, struggling below the $105,000 mark.
- It started a fresh drop below the $104,000 support and remains under the 100 hourly Simple Moving Average.
- A break occurred above a bearish trend line with resistance at $103,000 on the BTC/USD hourly chart.
- If Bitcoin fails to rise past $105,000, further declines are likely.
Price Movement and Resistance Levels
- The price dipped below key levels: $103,500, $102,000, and even spiked below $100,000, reaching a low of $98,900.
- A recovery is underway, but Bitcoin faces resistance at $103,500 and $104,000.
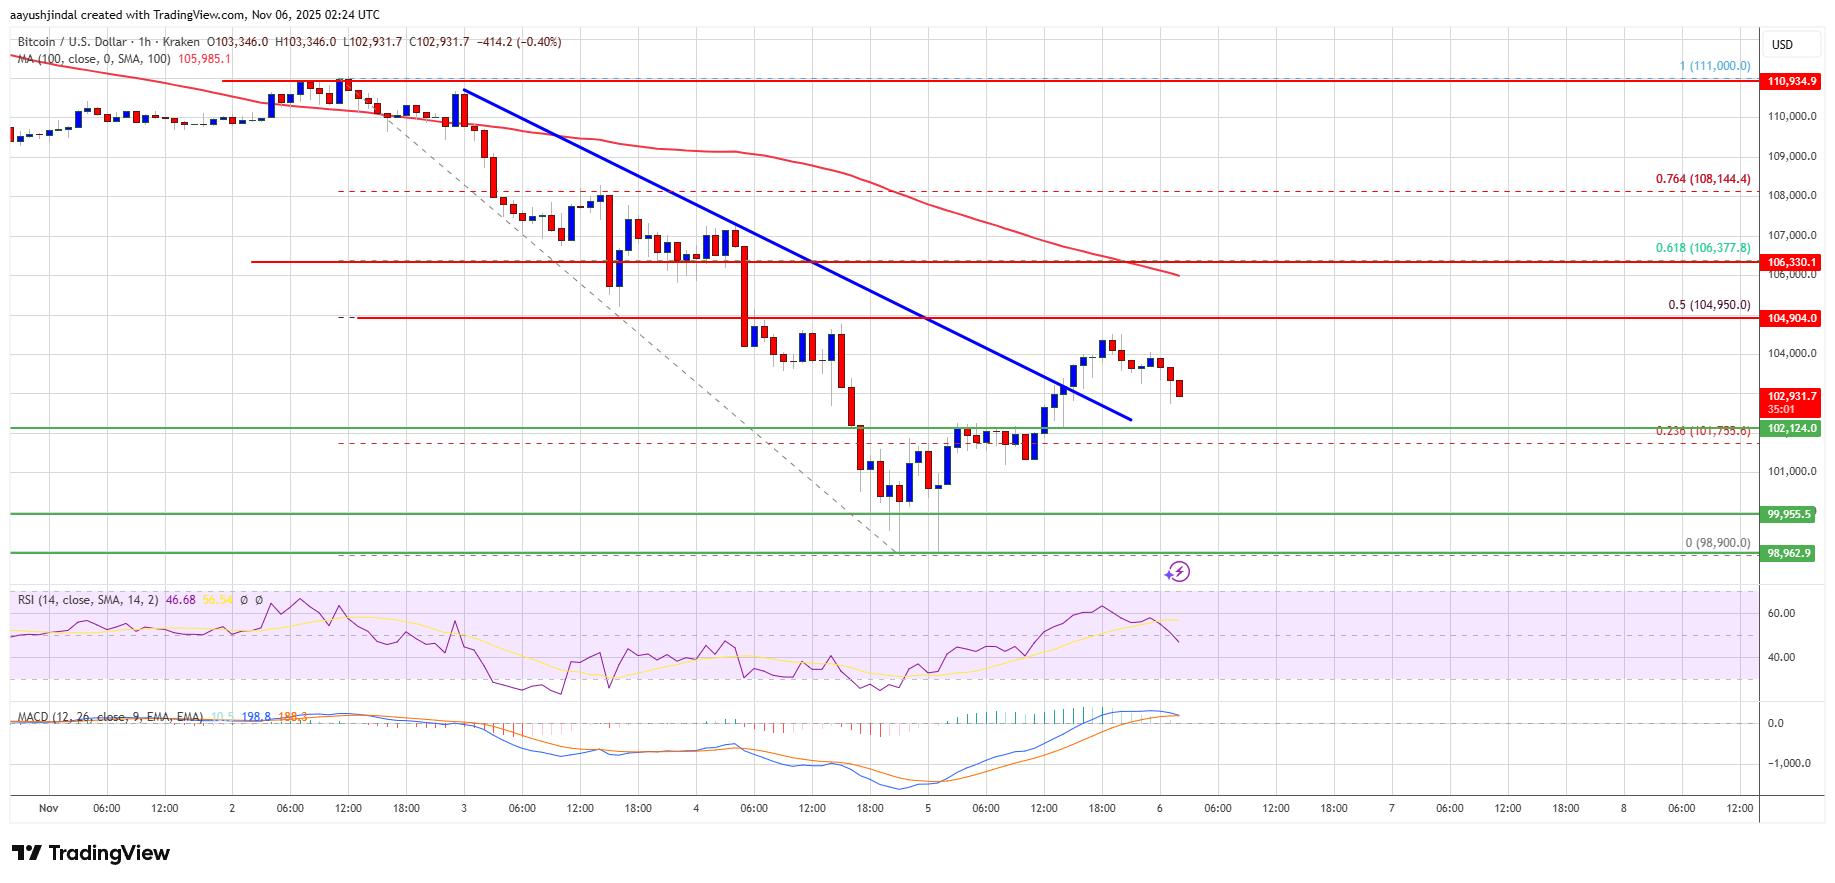
- Key resistance levels are $105,000 and possibly $106,500 if momentum builds.
- Further gains might target $107,500 or higher, with additional barriers at $108,500 and $108,800.
Potential Decline
- If Bitcoin cannot surpass $104,000, it may continue to fall.
- Immediate support lies at $102,150, with major support at $100,500.
- A drop below $100,000 could lead to testing $98,800 and major support at $97,500.
Technical Indicators:
- Hourly MACD: Increasing pace in the bearish zone.
- Hourly RSI: Below the 50 level for BTC/USD.
- Major Support Levels: $102,150, $100,500.
- Major Resistance Levels: $103,500, $104,000.