8 0
Bitcoin Struggles Below $116,000 Amid Recovery Efforts
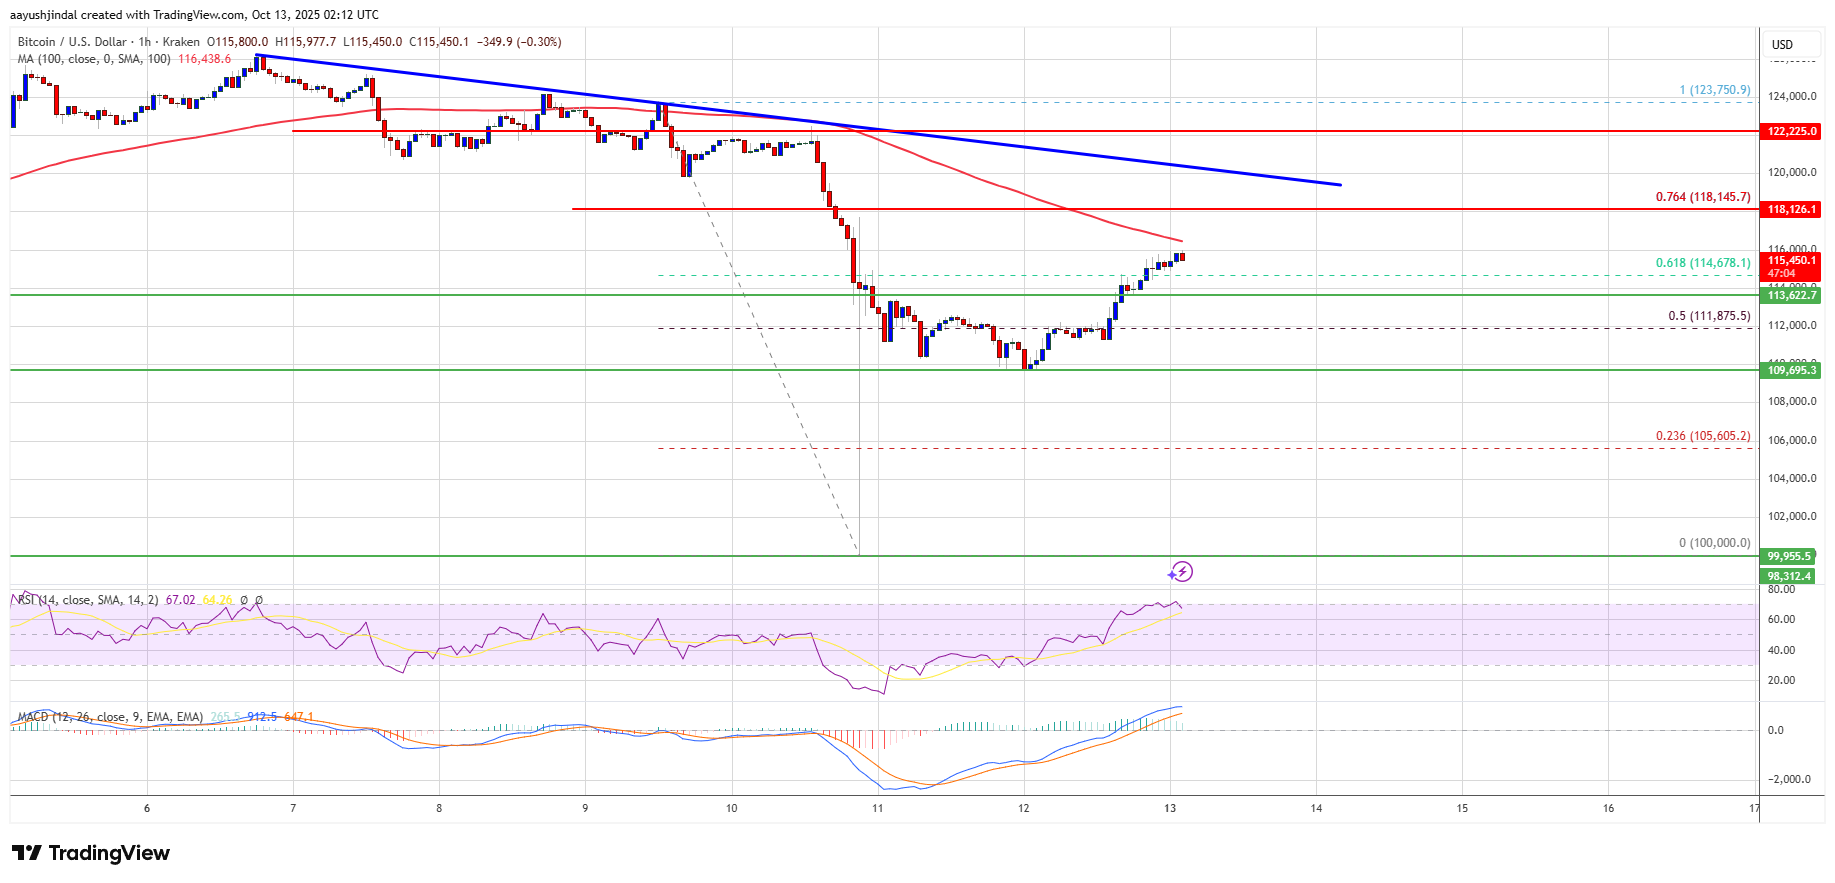
Bitcoin's price has initiated a recovery wave, surpassing the $113,500 resistance level after a sharp decline below $110,000. However, it remains under pressure, trading below $116,000 and the 100 hourly Simple Moving Average.
- BTC rose above the 50% Fibonacci retracement from $123,750 to $100,000.
- Immediate resistance is at $116,000, with further hurdles at $116,250 and $118,000.
- A bearish trend line presents resistance at $119,500 on the BTC/USD hourly chart.
If Bitcoin closes above $118,000, it could test $119,500, with potential gains towards $120,000 and $122,500. Conversely, failure to rise past $116,000 might trigger a decline, with supports at $114,000, $113,500, and potentially down to $112,500.
- Technical indicators:
- MACD is gaining in the bullish zone.
- RSI for BTC/USD is above 50.
- Major support levels are $113,500 and $112,500.
- Major resistance levels are $116,000 and $118,000.
