Feb 24, 2026
5 0
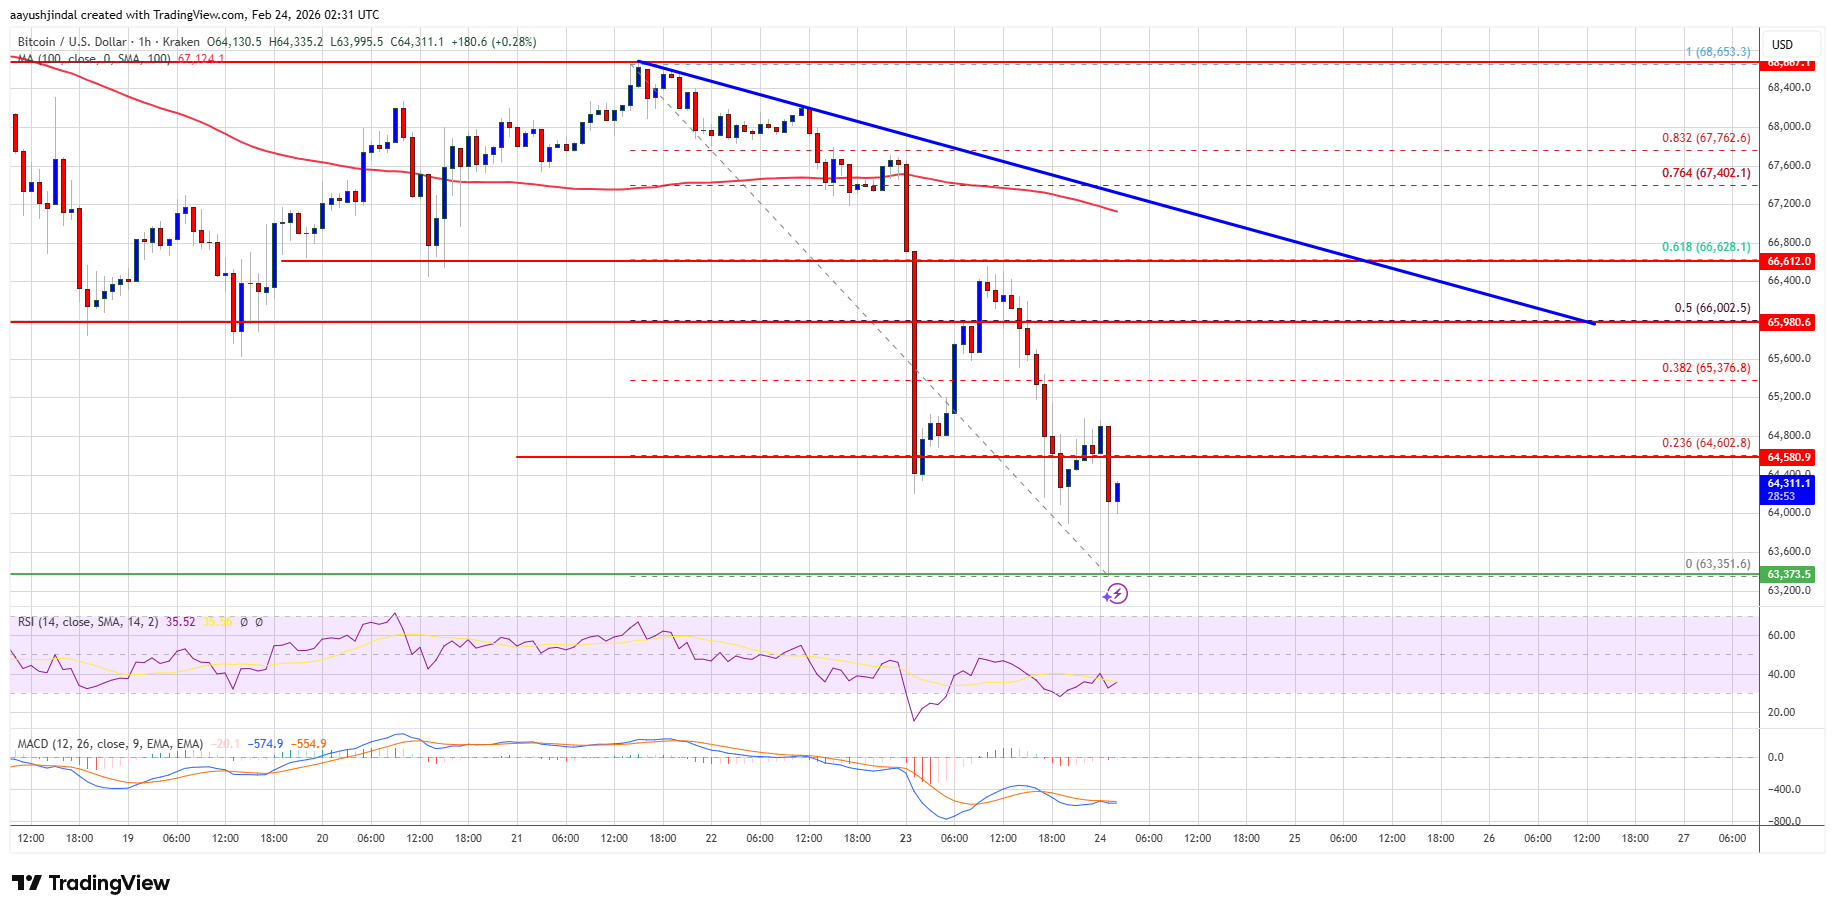
BEARISH 📉 : Bitcoin struggles below $66,000 after breaking key support
Bitcoin has experienced a decline, failing to maintain stability above $66,000.
- Currently trading below $65,500 and the 100 hourly simple moving average.
- A bearish trend line shows resistance at $66,800 on the BTC/USD hourly chart.
Key Insights:
- Bitcoin dipped below the $66,000 support, reaching a low of $63,351.
- The price is attempting a correction but remains under the 23.6% Fib retracement level from $68,652 to $63,351.
- Immediate resistance lies near $64,600, with key resistance at $65,250.
- A close above $65,250 could lead to testing the $66,000 resistance or the 50% Fib retracement level.
- Further gains may target $66,800, with subsequent barriers at $67,500 and $67,700.
Potential Decline:
- If unable to surpass $65,250, Bitcoin might drop again.
- Immediate support is at $64,000, with major supports at $63,500 and $63,200.
- Below $62,650, the main support is at $62,000, potentially hindering recovery.
Technical Indicators:
- Hourly MACD: Bearish momentum increasing.
- Hourly RSI: Below 50, indicating potential continued weakness.
Investors should monitor these levels closely for further developments.