Feb 18, 2026
2 0
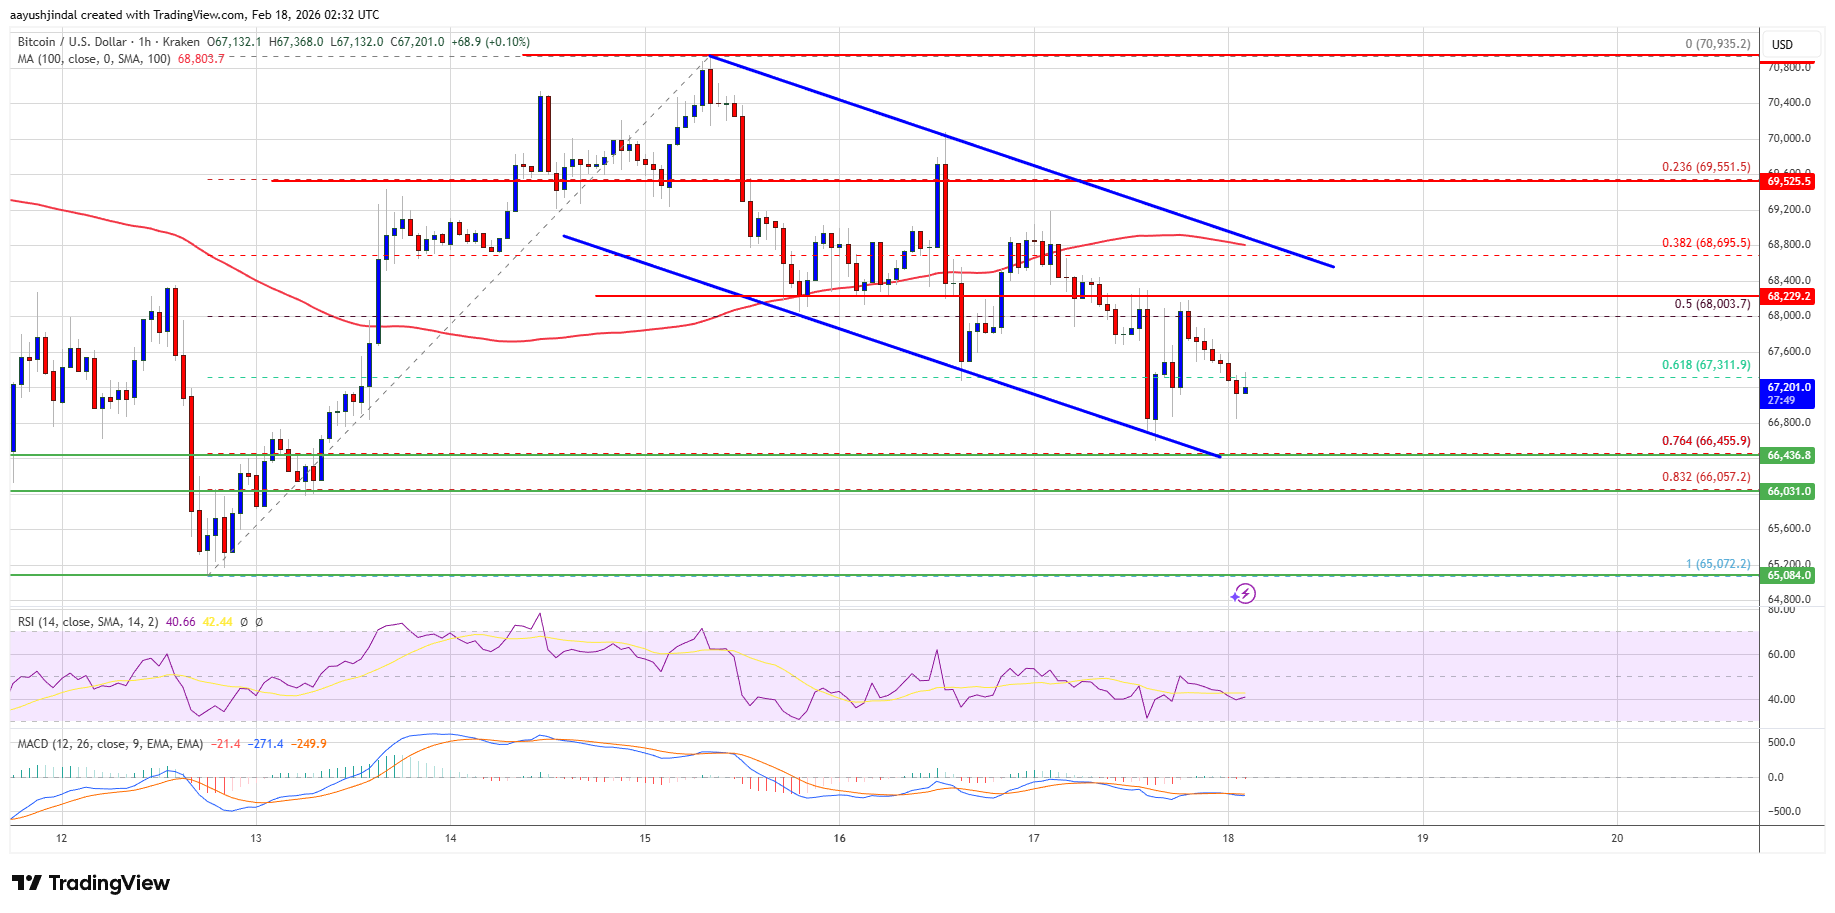
BEARISH 📉 : Bitcoin struggles below $67,500 amid potential further decline
Bitcoin Price Analysis
- Bitcoin's price is struggling, moving below $67,500 and the 100 hourly simple moving average.
- A declining channel with resistance at $68,850 is forming on the BTC/USD hourly chart.
- The price tested the $66,500 support after dipping below the 61.8% Fib retracement level from the $65,072 to $70,935 range.
- If Bitcoin remains above $66,500, it may attempt a rise, with immediate resistance at $68,000.
- A close above $68,850 could push the price towards $69,200 or even $70,000.
- Failure to rise above $68,850 might lead to another decline, with major supports at $66,500 and $66,000.
- If losses continue, Bitcoin could drop towards $64,200 or the main support at $63,500.
Technical Indicators
- Hourly MACD: Gaining pace in the bullish zone.
- Hourly RSI: Below the 50 level for BTC/USD.
- Major Support Levels: $66,500, $66,000.
- Major Resistance Levels: $68,000, $68,850.