Feb 20, 2026
1 0
BEARISH 📉 : Bitcoin struggles below $67,500 amid declining channel formation
Bitcoin Price Analysis
- Bitcoin's price is currently below $67,500 and the 100 hourly simple moving average.
- A declining channel with resistance at $67,400 is forming on the BTC/USD hourly chart.
- The price might dip if it goes below $66,500 and $66,000.
Current Market Situation
- Bitcoin failed to hold above $67,500, dropping below $67,200.
- A low was formed at $65,650, with a partial recovery seen.
- The price remains under key resistances at $67,400 and $68,000.
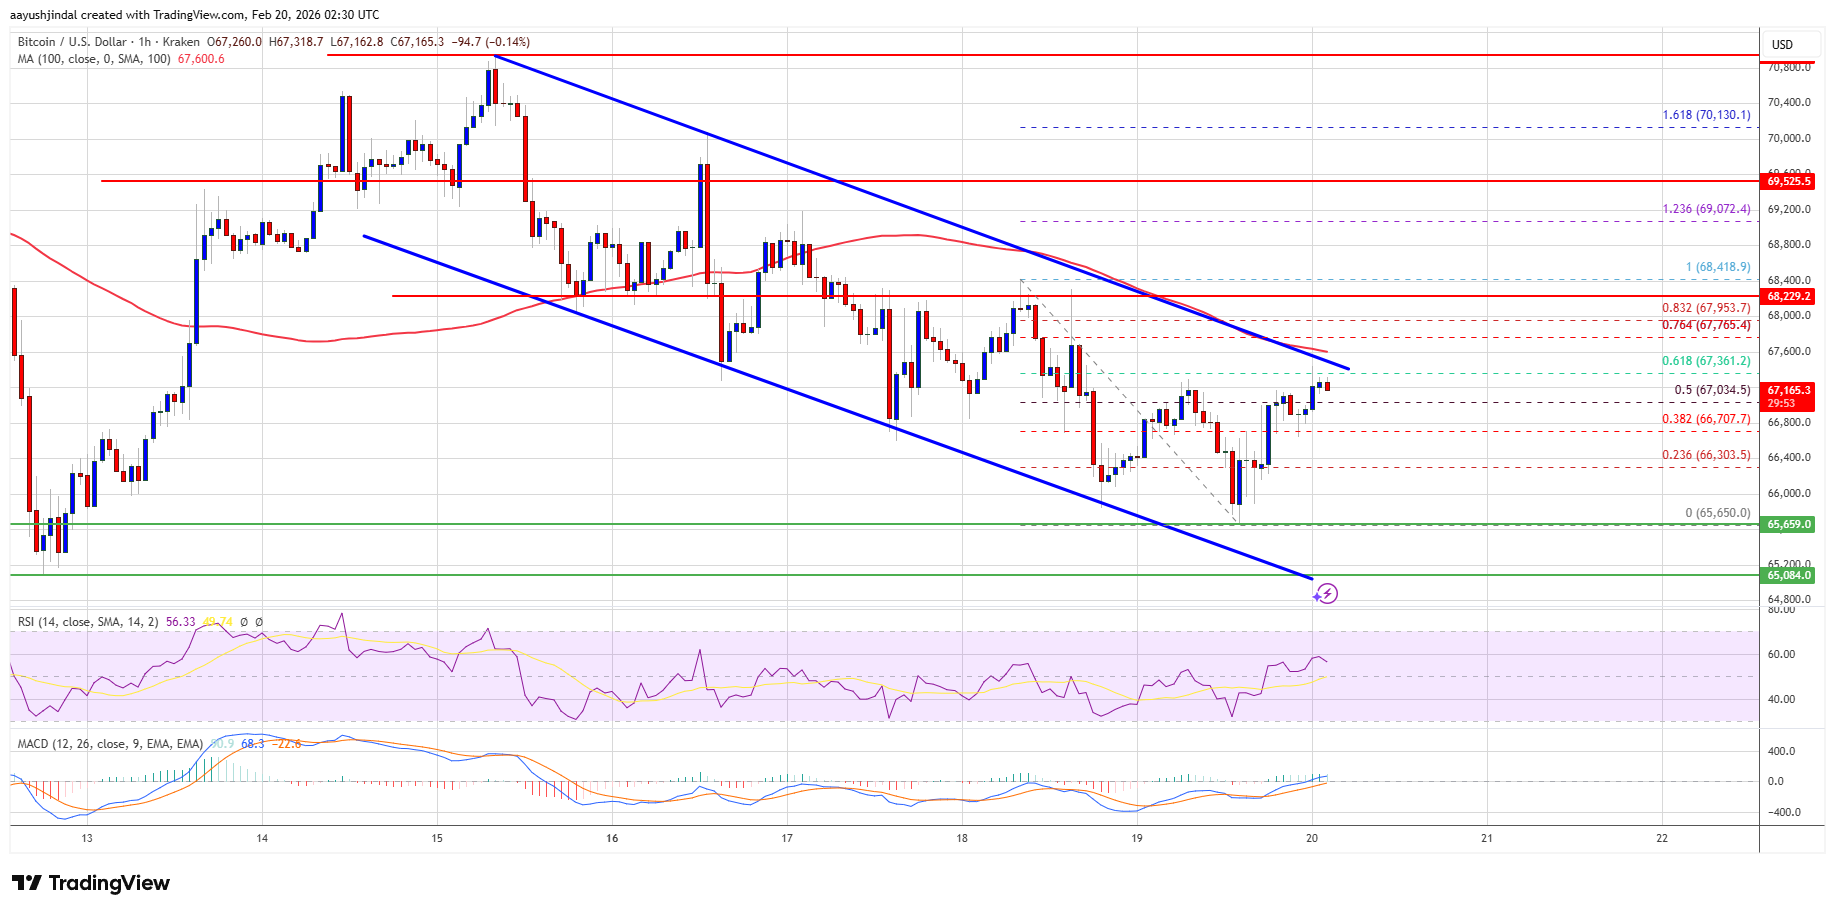
- If Bitcoin closes above $68,000, it may rise towards $68,800 and potentially $70,000.
Potential for Further Decline
- If unable to break $68,000, Bitcoin may decline again, with immediate support at $66,000.
- Further support levels are at $65,650 and $65,050, with major support at $63,800.
Technical Indicators
- Hourly MACD shows a slowdown in bearish momentum.
- Hourly RSI for BTC/USD is above 50.
- Key support levels: $66,000, $65,650
- Key resistance levels: $67,400, $68,000