Feb 17, 2026
2 0
BEARISH 📉 : Bitcoin struggles below $70,000 with potential for further decline
Bitcoin's price experienced a correction, testing the support at $67,500, and is now recovering.
- The price is above $68,800 and the 100-hourly simple moving average.
- A declining channel with resistance at $69,550 is forming on the hourly BTC/USD chart.
- If Bitcoin dips below $68,000, it may test the $67,400 level again.
- Key resistance levels to watch are $69,500 and $70,500, with potential to reach $71,200 if broken.
- Support levels include $68,000 and $67,400, with stronger support at $65,000.
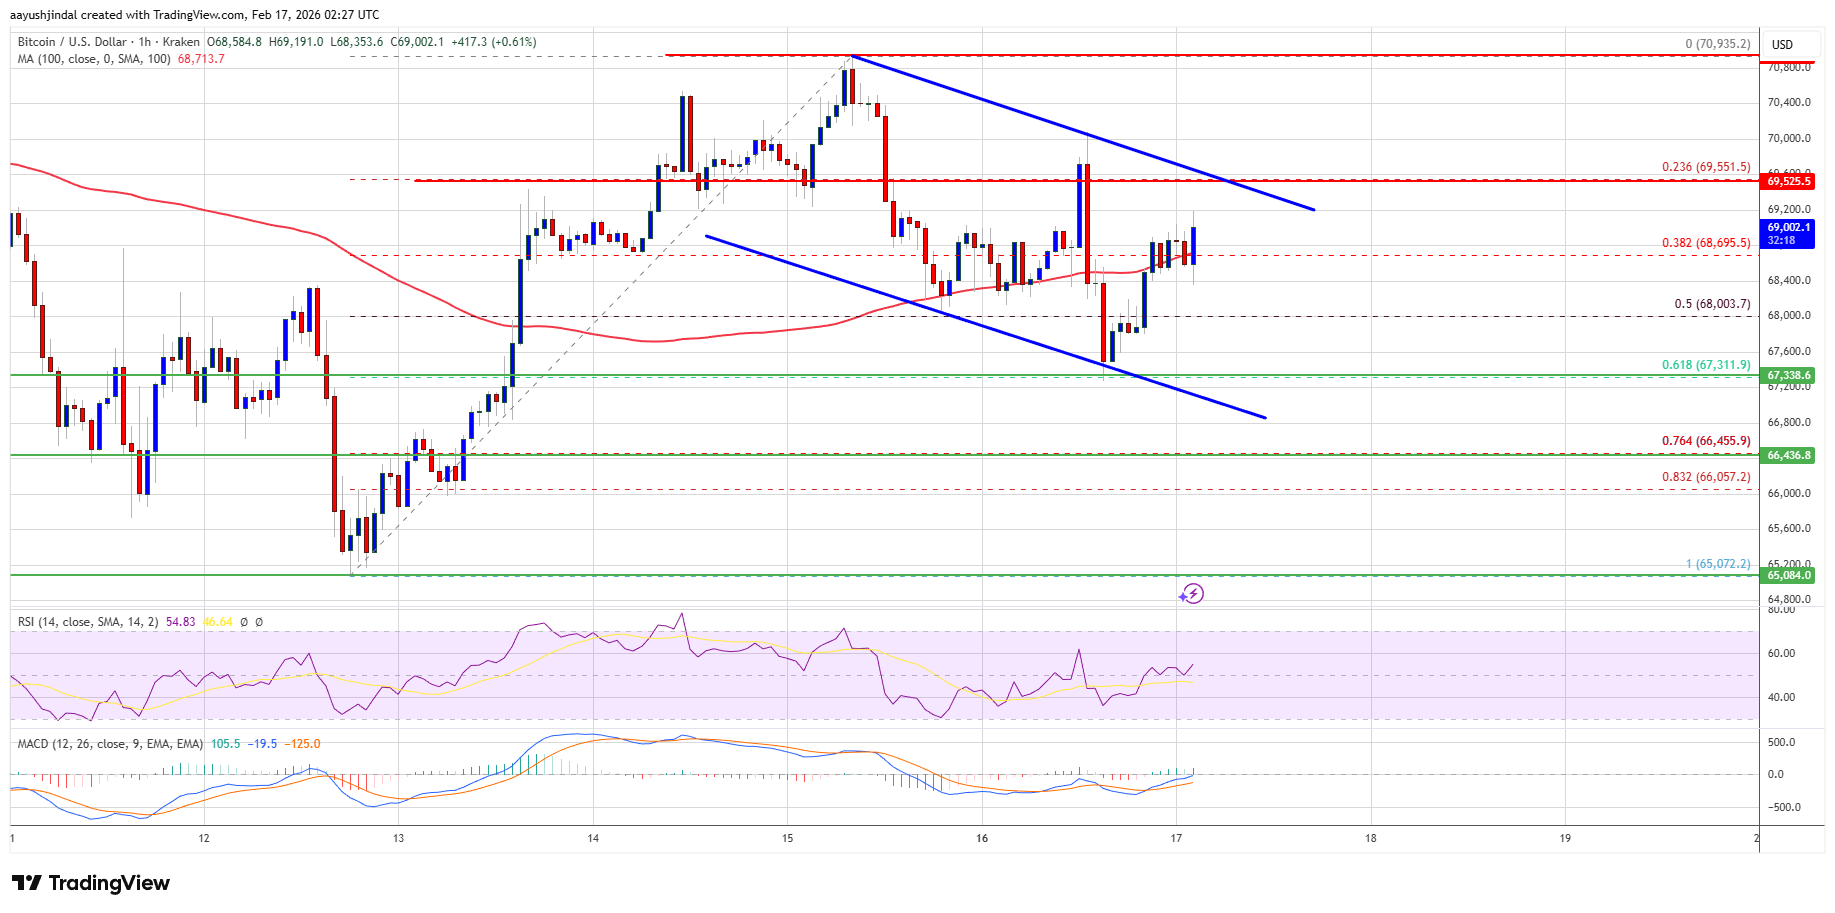
Technical indicators:
- Hourly MACD shows bullish momentum.
- Hourly RSI is above 50, indicating strength.