Feb 11, 2026
3 0
BEARISH 📉 : Bitcoin struggles below $70,000 facing strong resistance levels
Bitcoin Price Analysis
- Bitcoin is attempting recovery but facing resistance around $72,000.
- The price is below $70,000 and the 100 hourly simple moving average.
- A bearish trend line with resistance at $69,200 is forming on BTC/USD's hourly chart.
- A dip may occur if Bitcoin drops below $68,000 and $67,700.
Bitcoin has stabilized above $66,500 and climbed above the $68,000 resistance zone. The price exceeded the 50% Fib retracement level between $78,988 and $60,500. Resistance remains strong near $72,200 and $72,500.
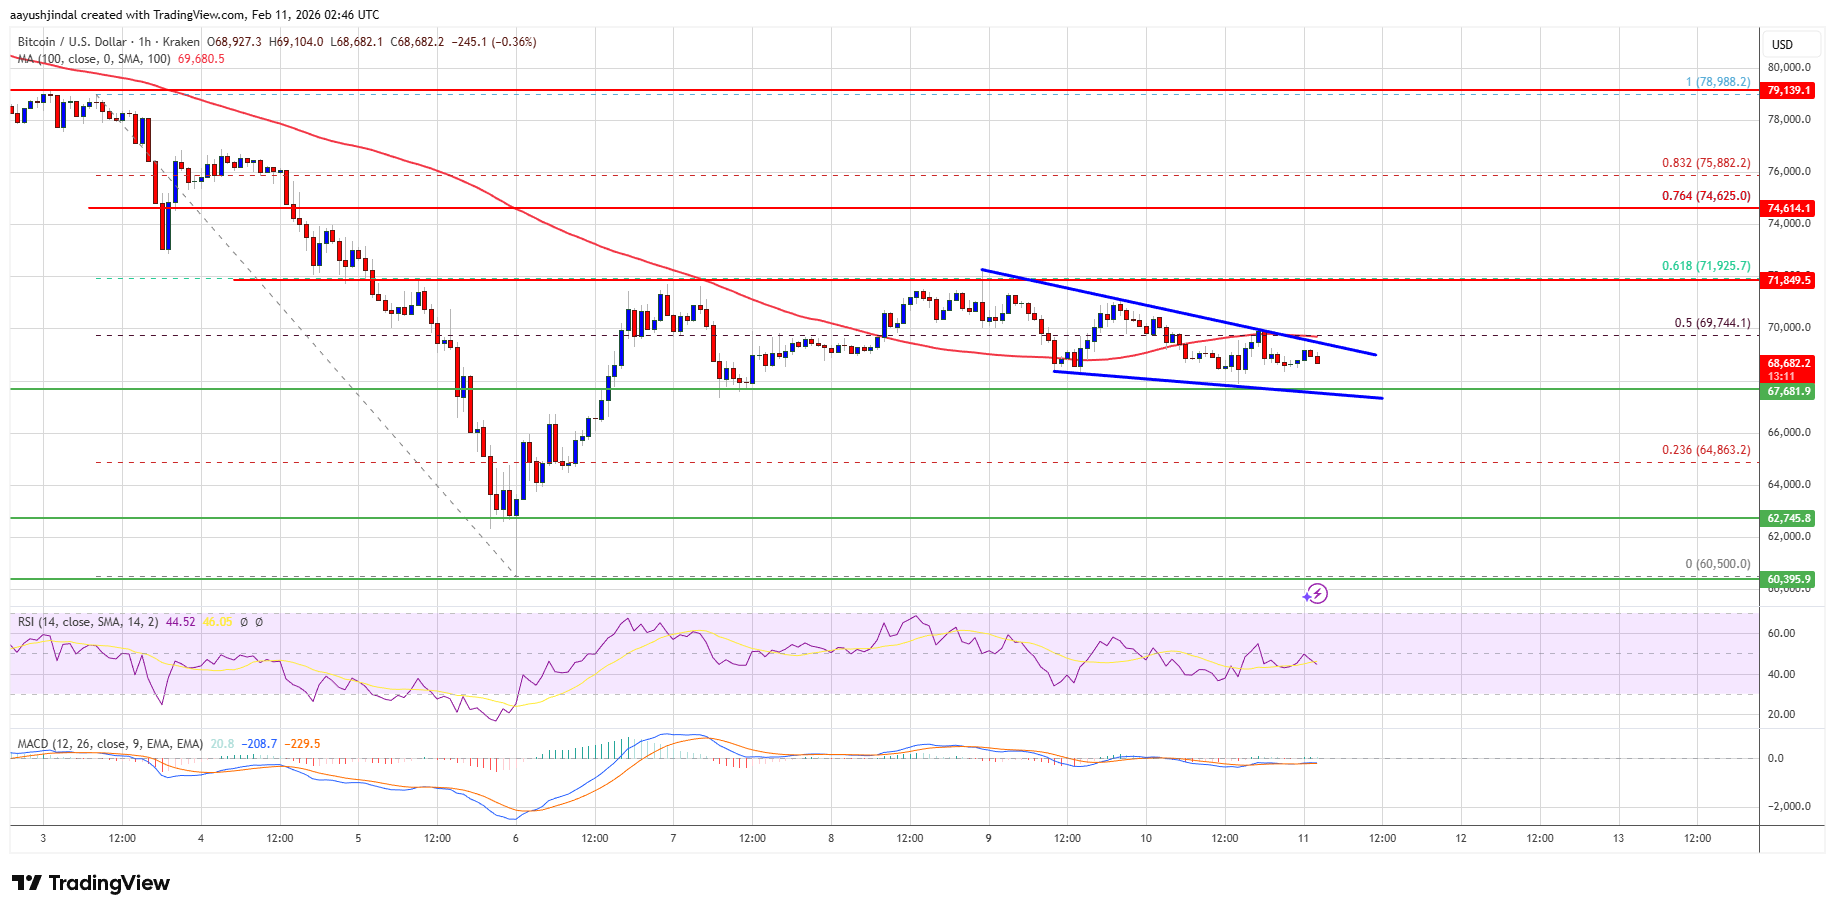
Immediate resistance is at $69,200. A rise above $71,000 could lead to testing the $72,000 resistance. Further gains might target $73,500, with barriers at $74,000 and $74,500.
Potential Decline Scenario
- If Bitcoin doesn't surpass the $71,500 resistance, a decline is possible.
- Immediate support lies at $68,000, with major support at $67,650.
- Further losses could push the price towards $65,000, with main support at $63,200.
Technical Indicators
- Hourly MACD: Gaining pace in the bearish zone.
- Hourly RSI: Below the 50 level.
- Major Support Levels: $68,000, $67,600
- Major Resistance Levels: $71,500, $72,000