Feb 4, 2026
2 0
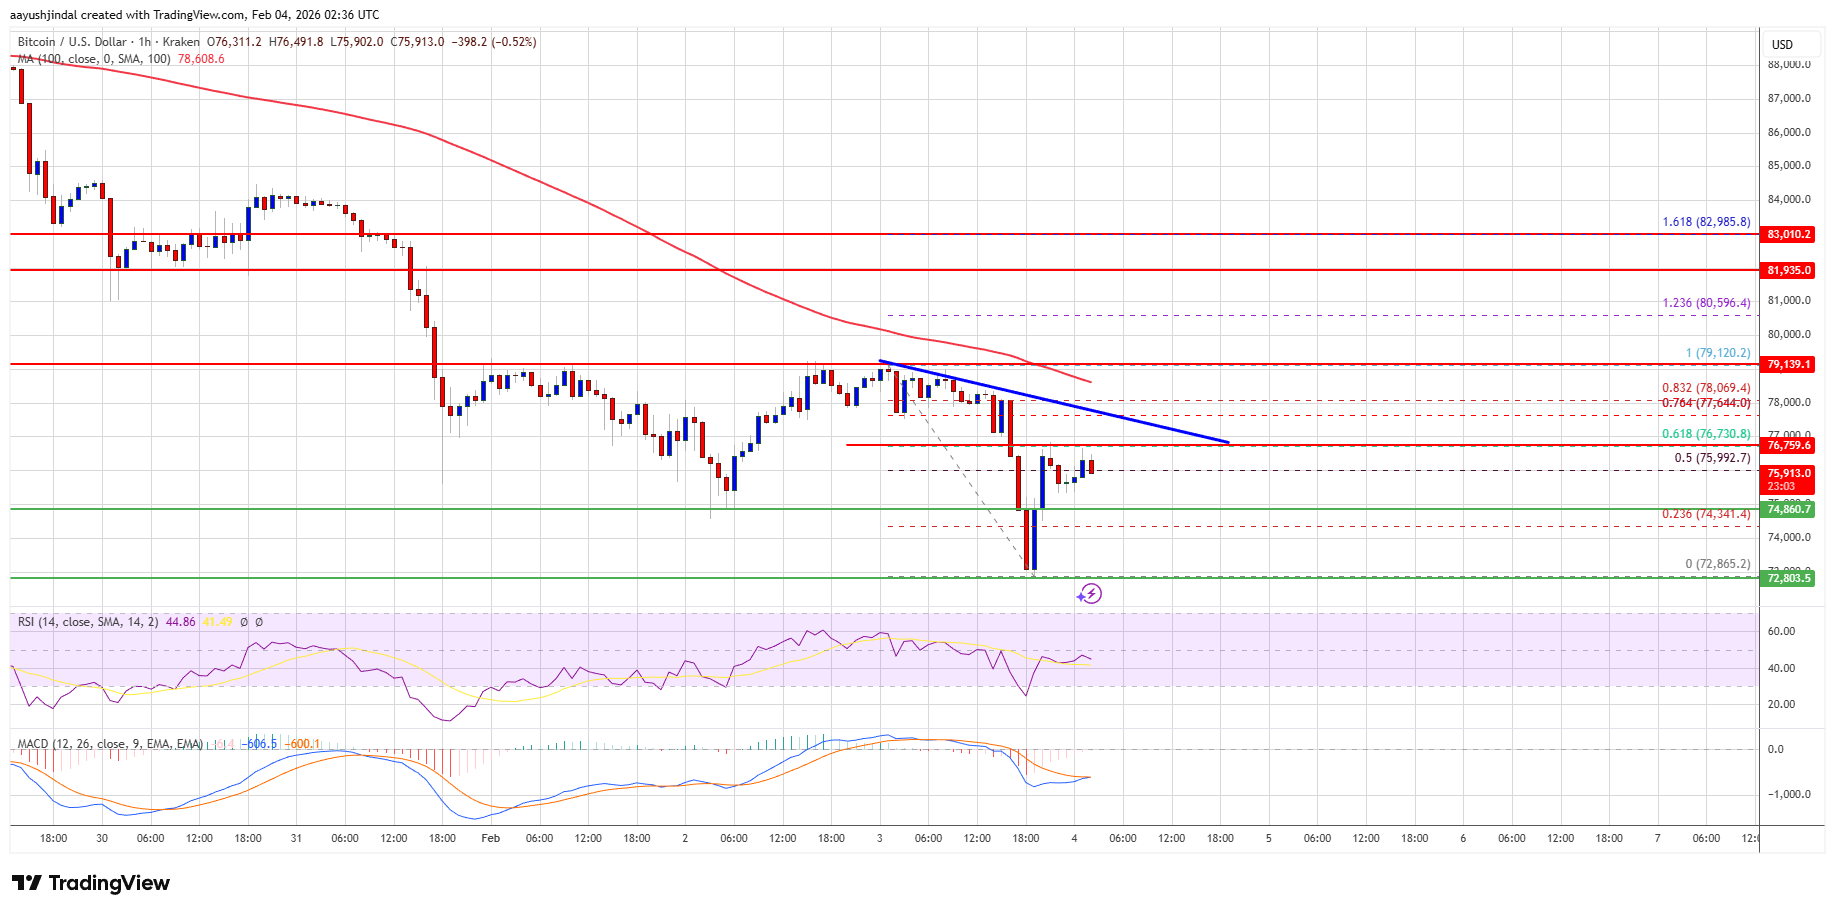
BEARISH 📉 : Bitcoin struggles below $77,200 resistance amid recovery attempts
Bitcoin Price Analysis
- Bitcoin is attempting a recovery above $74,000 and $75,000 after declining below $75,000.
- The price is trading below $77,000 and the 100 hourly simple moving average.
- A bearish trend line is forming with resistance at $77,200 on the BTC/USD chart (data from Kraken).
- A further decline is possible if trading falls below $75,000 and $74,000.
Bitcoin's price failed to stabilize above $76,000 and extended its decline below $75,000. The bears pushed the price below $73,500, forming a low at $72,865. It has since attempted a recovery, surpassing the 50% Fibonacci retracement level of the move from $79,120 to $72,865.
Resistance is seen near $77,000, corresponding with the 61.8% Fibonacci retracement level. A close above $77,200 might lead to testing the $78,500 resistance. Further gains could target $79,000, with potential barriers at $80,000 and $80,500.
Potential Decline Risks
- If Bitcoin doesn't rise above $77,200, it may face another drop.
- Immediate support is at $75,000, with major support at $74,000.
- The next support levels are near $72,850 and $71,500, with main support at $70,000.
Technical Indicators:
- Hourly MACD: Gaining pace in the bearish zone.
- Hourly RSI: Below the 50 level.
- Major Support Levels: $75,000, $74,000.
- Major Resistance Levels: $76,750, $77,200.