Nov 12, 2025
4 0
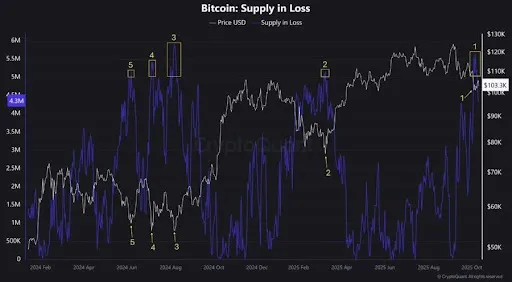
Bitcoin Supply-Loss Chart Indicates Potential Market Bottom Formation
The cryptocurrency market is experiencing a challenging period, with the Bitcoin Supply-Loss chart indicating a potential bottom.
Key Insights from Bitcoin Supply-Loss Chart
- High levels in the Supply-Loss chart signal fear and possible market bottoms, while low levels indicate market greed.
- On April 7, 2025, BTC's supply in loss was 5.159 million BTC when the price was $74,508.
- By November 5, 2025, BTC rose to $98,966, yet the supply in loss increased to 5.639 million BTC.
- Recent data shows a rise in supply-loss to 28%-33%, equivalent to 5.5-6.5 million BTC.
- This pattern may suggest short-term bearish pressure but could lead to a market bounce in Q4 2025 and Q1 2026.
Accumulation Phase Insights
- Bitcoin has undergone three major corrections, each followed by new all-time highs.
- According to analyst 0xBossman, current corrections are flushing out leveraged traders.
- Boredom and indecision lead to bearish sentiment, affecting altcoin markets.
- Consolidation phases typically end with significant upward movements.