Analyst Identifies Key Support Levels for Bitcoin at $75,100 and $62,400
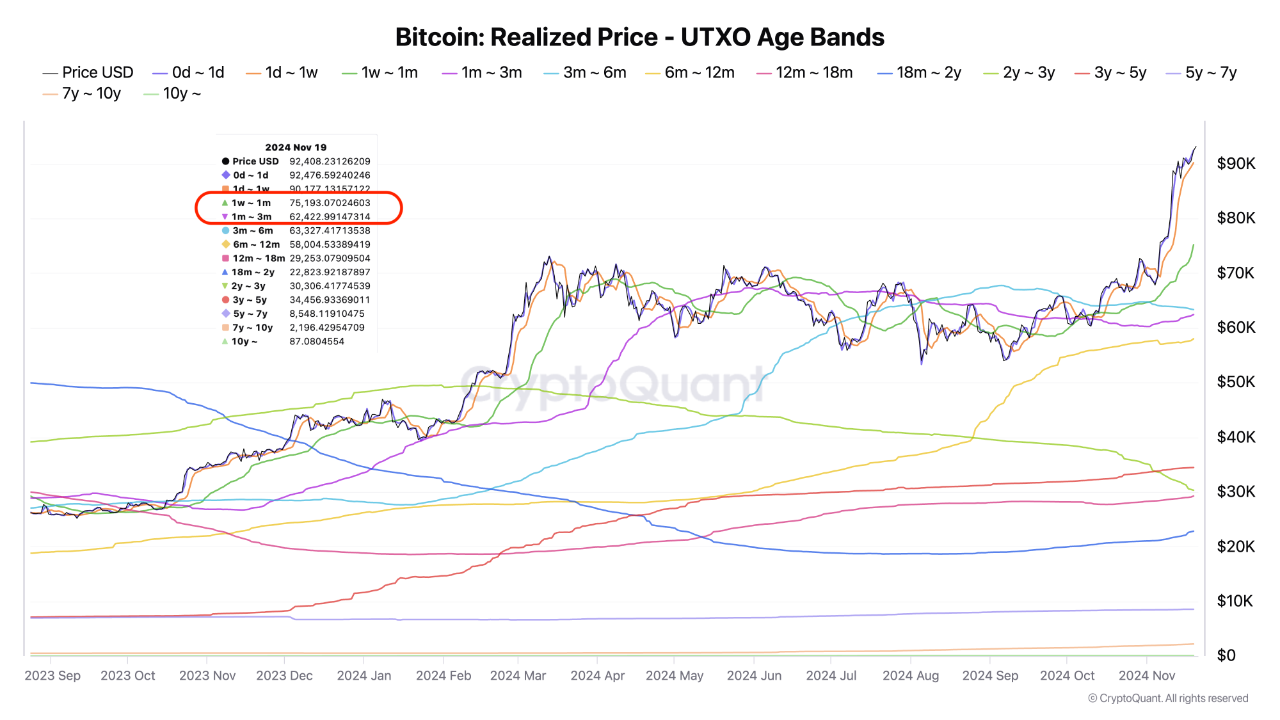
A recent analysis by CryptoQuant analyst tugbachain highlights the UTXO Realized Price Age Distribution, a key metric for understanding Bitcoin market behavior. This metric helps identify the holding patterns of various investor groups and their responses to price changes. The realized price is calculated as the Realized Cap divided by total supply, serving as an indicator of cost bases among long-term holders and recent buyers.
According to tugbachain, the realized price levels for one-month and three-month periods are critical zones during bull market corrections. These levels facilitate analysis of market sentiment, particularly among smaller investors, providing insights into buying and selling dynamics.
Key Support Levels For BTC
The analyst identifies two significant realized price levels—$75,100 and $62,400—as key cost bases for small investors. These levels act as support zones during market volatility. Historically, when Bitcoin's price tests these levels, it often triggers buying reactions, reflecting the psychological and financial influence of these points on smaller investors.

tugbachain notes that these support levels reveal patterns of small investors and how their actions can be influenced or manipulated in a bull market. During bullish cycles, market dynamics may amplify fear among these investors, leading to panic selling.
Monitoring these levels closely can provide valuable insights for making informed investment decisions.
Bitcoin Market Performance
Bitcoin has recently reached a new all-time high (ATH) of $94,784. Currently, it is trading at $94,523, up 3.1% over the past day. Despite consistent upward momentum in recent weeks, CryptoQuant has analyzed whether it is time to sell or hold BTC, referencing key metrics such as the MVRV ratio.
Historically, an MVRV ratio above 3.7 indicates a market top for Bitcoin. Current data shows BTC’s MVRV at 2.62 as of November 19, below the critical level.
Bitcoin Hits ATH: Is It Time to Sell or Hold?
MVRV > 3.7 has historically marked market tops.
Explore these 4 additional key metrics to better understand market timing and make more informed decisions.
Details below
pic.twitter.com/ewavOhofBR
— CryptoQuant.com (@cryptoquant_com) November 19, 2024
Featured image created with DALL-E, Chart from TradingView.