Analyst Identifies Bitcoin Support Zone Between $95,090 and $96,531
The price of Bitcoin remains stable, currently near $98,000, following a rebound at the start of January 2025. Speculation surrounds whether Bitcoin has exited its correction phase, with expectations for a bull market increasing.
Strong Bitcoin Support Zone Emerges Between $95,090-$96,531
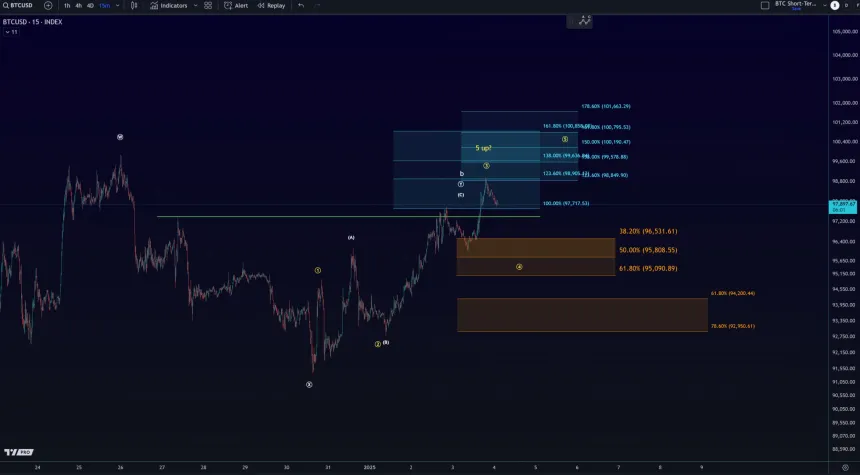
On January 4, digital asset analysis platform More Crypto Online shared insights regarding Bitcoin's market status. They applied Elliott Wave Theory to suggest that Bitcoin may have developed a potential 5-wave pattern indicative of bullish movement. This theory posits that financial markets exhibit predictable patterns due to investor psychology and natural market rhythms.
The 5-wave pattern, known as the impulsive wave pattern, typically aligns with the larger trend's direction. Despite recent corrections, Bitcoin's bullish shape suggests the completion of this pattern could lead to a significant price rally. To confirm the possibility of new all-time highs, Bitcoin must surpass the December 26 peak of $99,900, a key resistance level. If any rejections or retracements occur during this bullish momentum, analysts indicate a notable support zone between $95,090 and $96,531 that could cushion potential retests.
In the event of strong selling pressure, Bitcoin could decline to around $92,950, reflecting a potential 5.5% drop from its current value.
BTC Price Overview
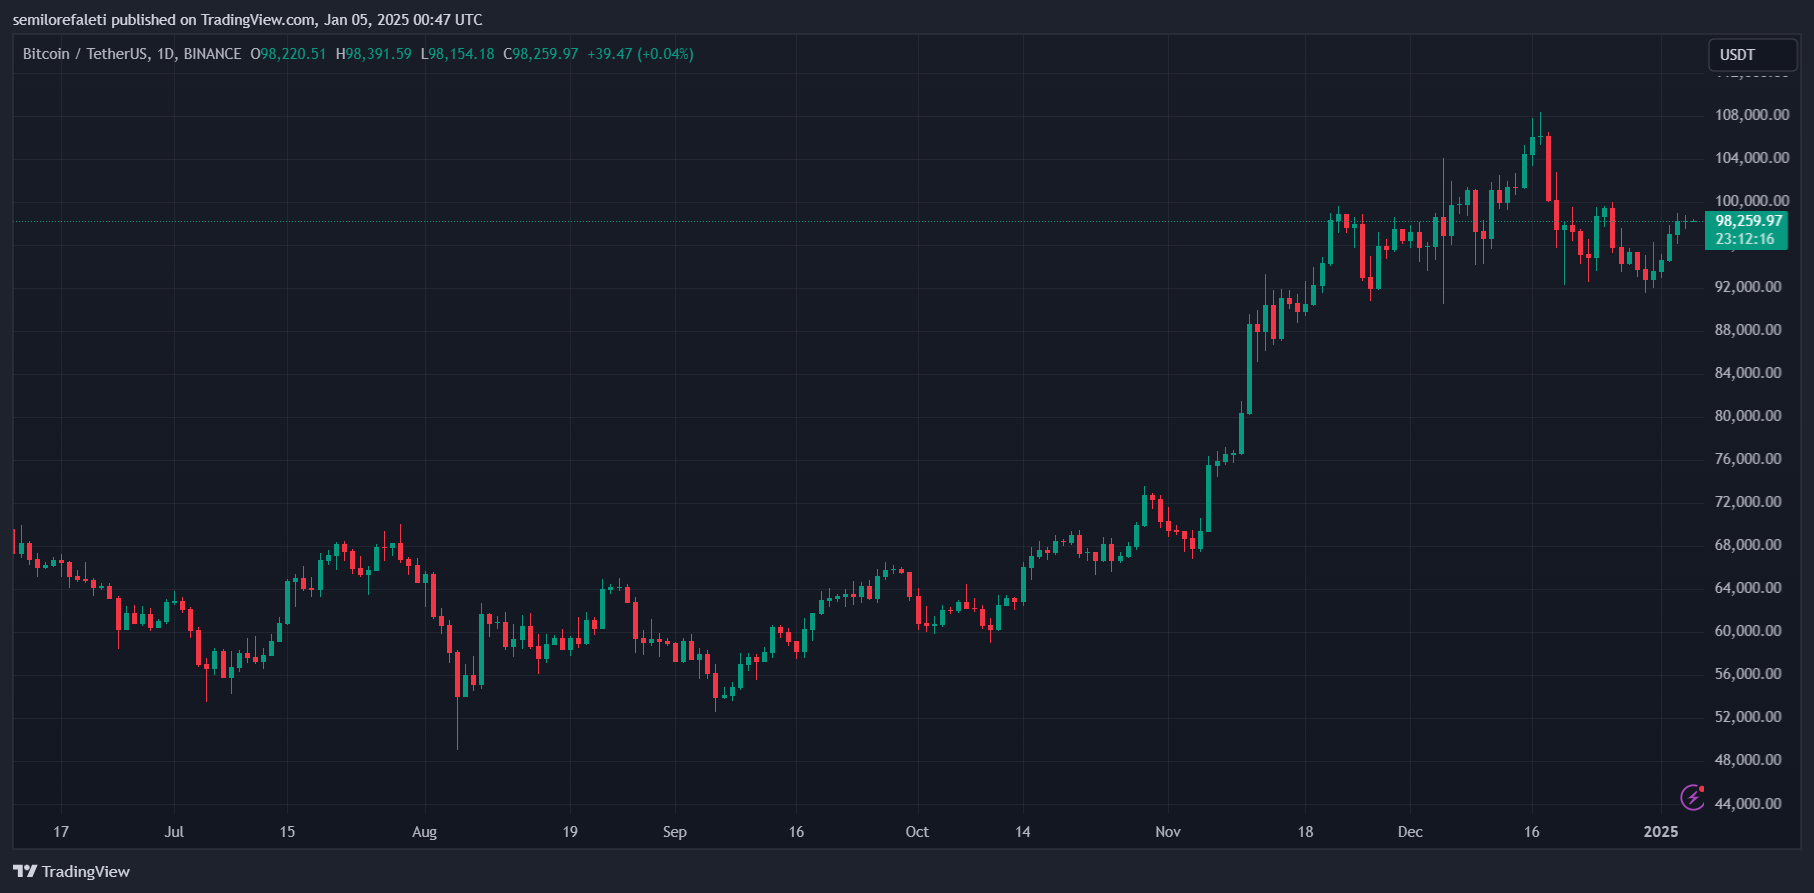
Currently, Bitcoin trades at $97,227, marking a 0.21% increase over the past 24 hours. Daily trading volume has decreased by 17.25%, totaling $30.03 billion. Over the past week, Bitcoin has appreciated by 3.57% but is down 3.79% for the month. In the past year, Bitcoin has gained 121.32%, making it one of the top-performing cryptocurrencies.
According to Coincodex data, sentiment for Bitcoin remains bullish, with the Fear & Greed Index at 73, indicating "almost" extreme greed among investors. Analysts anticipate that with a pro-crypto US government potentially emerging, Bitcoin could reach $132,775 in Q1 2025 and rise as high as $172,192 by June.
Featured image from Finbold, chart from Tradingview