Aug 17, 2025
6 0
Bitcoin’s 30-Day CDD Declines as Market Absorbs Selling Pressure
Bitcoin Price Dynamics
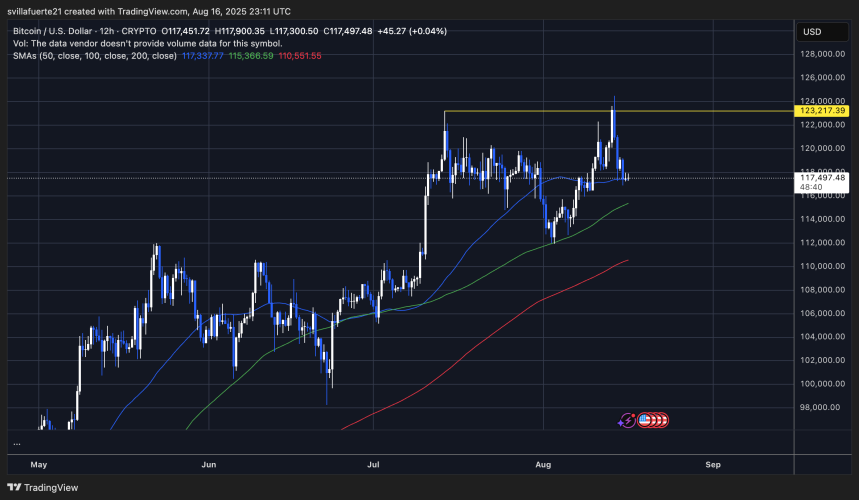
- Bitcoin reached a peak of $124,000 but has since retraced to around $117,497.
- Current trading reflects indecision among traders, balancing profit-taking and accumulation.
- Key resistance is noted at $123,217 with support levels at the 50-day SMA (~$117,337) and 100-day SMA (~$115,366).
On-Chain Metrics
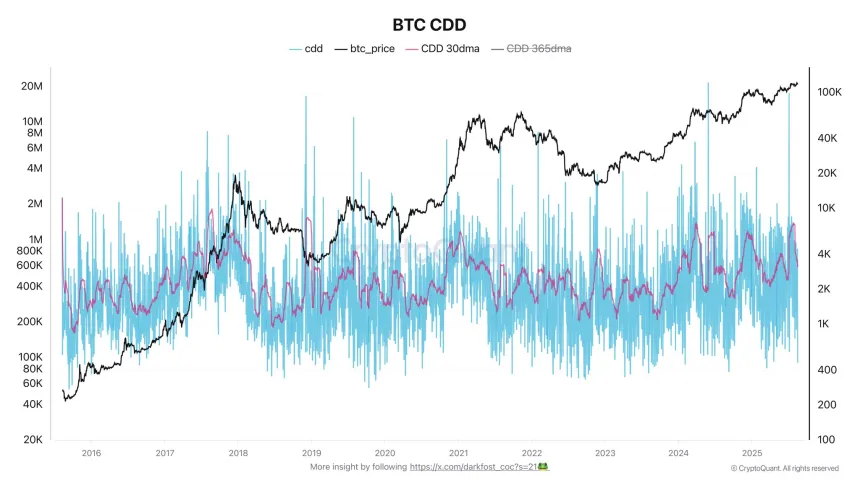
- The Coin Days Destroyed (CDD) indicator, tracking long-term holder activity, spiked recently before declining, indicating reduced selling pressure.
- A surge in CDD suggested profit-taking was occurring, yet Bitcoin's price remained stable, signaling strong demand.
- As of late July, the decline in CDD indicates fewer older coins are entering the market, suggesting renewed accumulation.
Market Outlook
- Continued easing of selling pressure may allow BTC to consolidate and prepare for further upward movement.
- A breakout above $124K could lead to a target of $130K or higher; a drop below $115K may indicate weakness in the trend.
- Momentum indicators suggest consolidation rather than distribution, reflecting resilience in the current market structure.