1 0
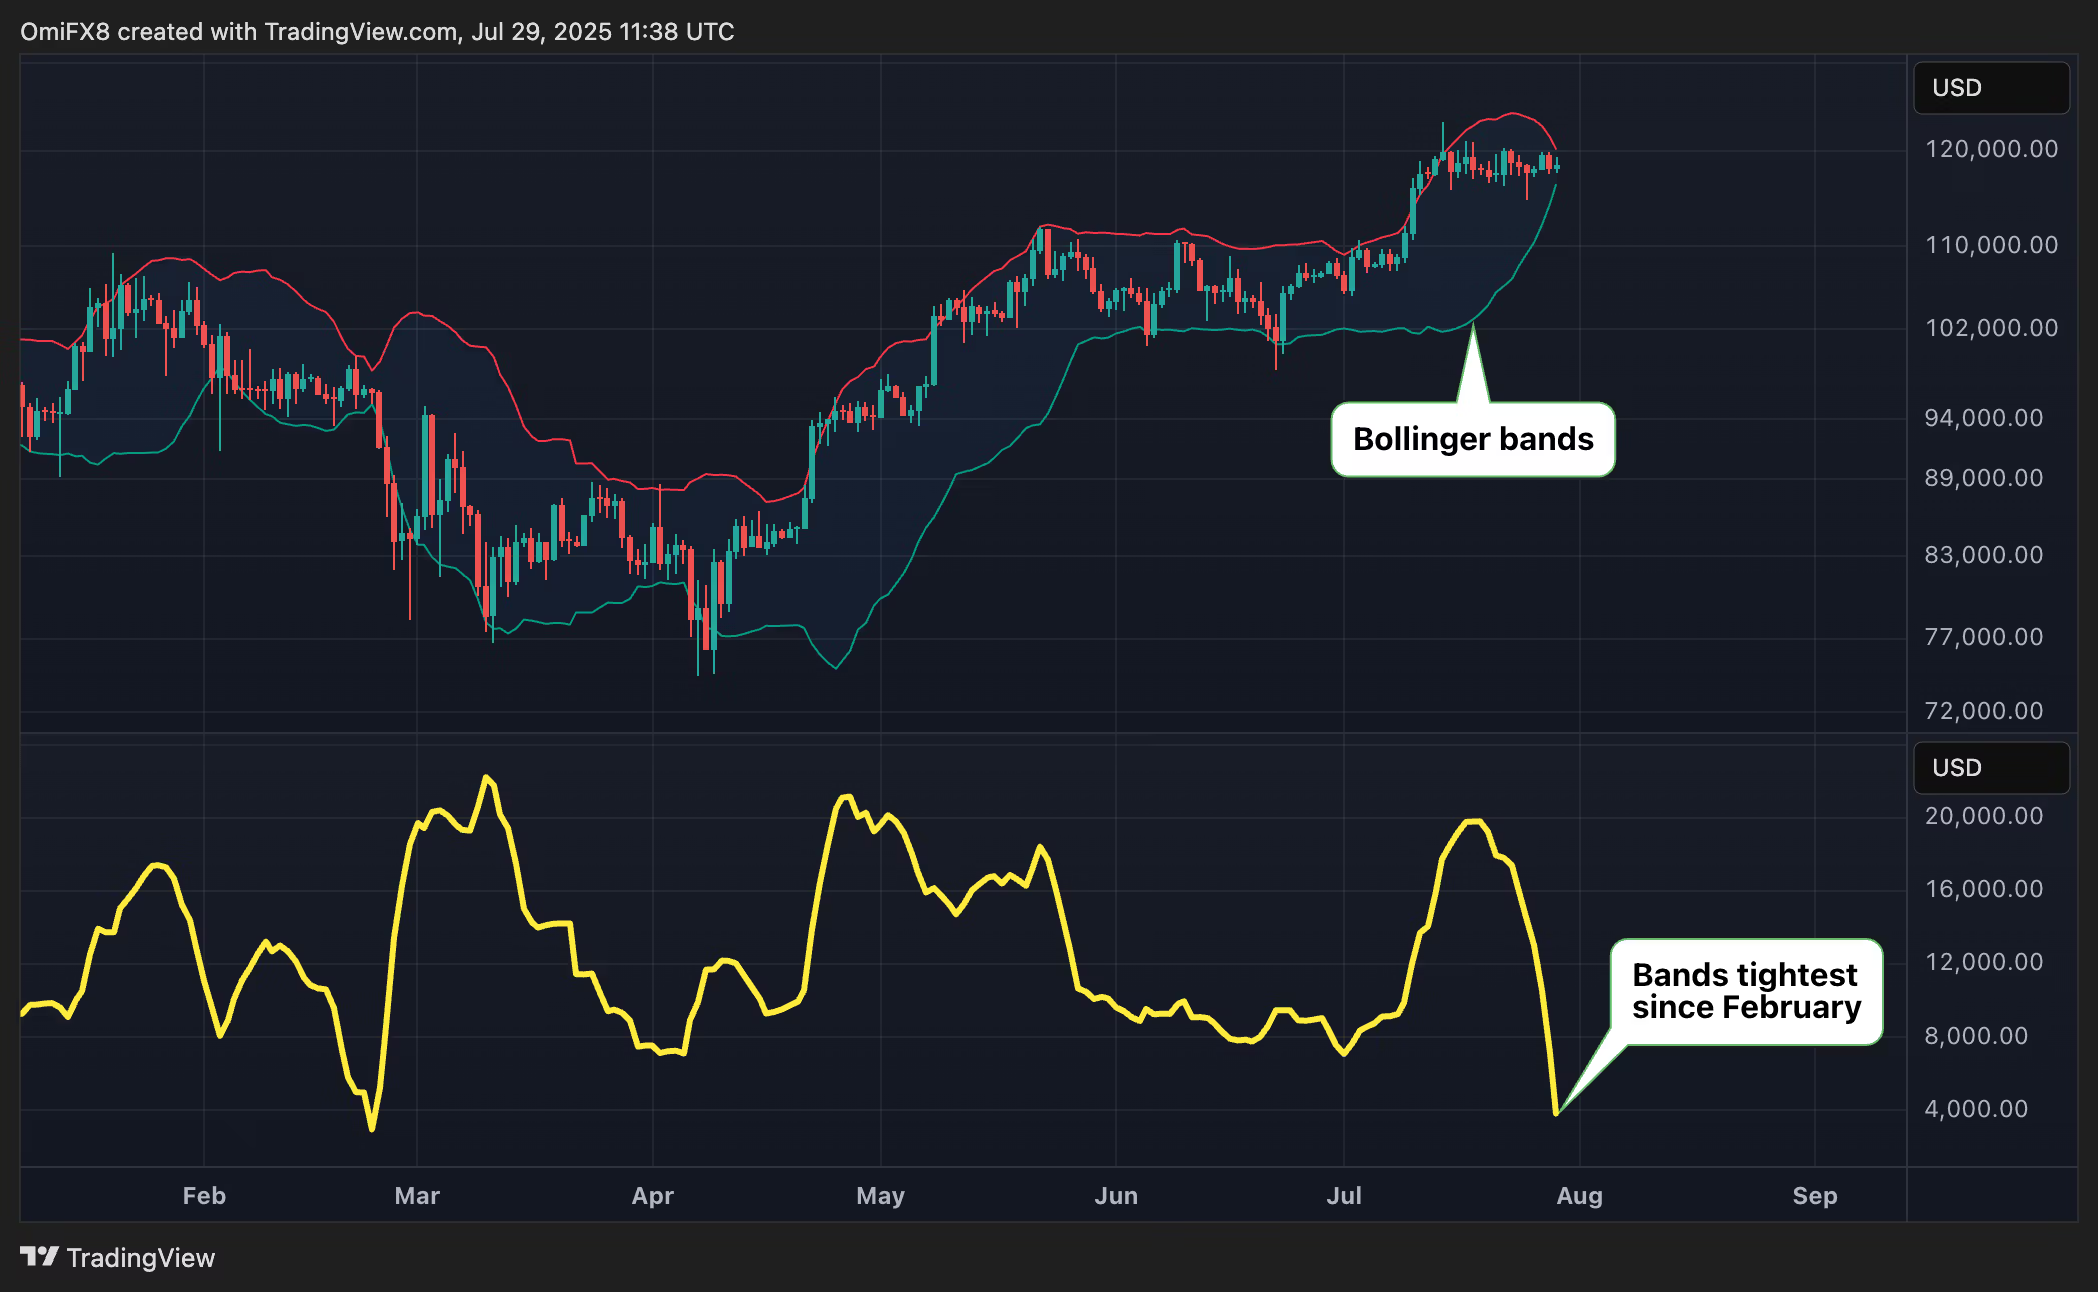
Bitcoin’s Bollinger Bands Tighten to Levels Last Seen in February
Daily Analysis of Top Tokens with CME Futures
Bitcoin: Bollinger Bands Tighten
BTC is consolidating between $116,000 and $120,000. Bollinger bands have tightened, indicating potential volatility ahead. A break below $116,000 could lead to a drop towards $111,965, while a movement upwards may push prices to new highs.

- Resistance: $120,000, $123,181
- Support: $116,000-$117,000, $114,700, $111,965
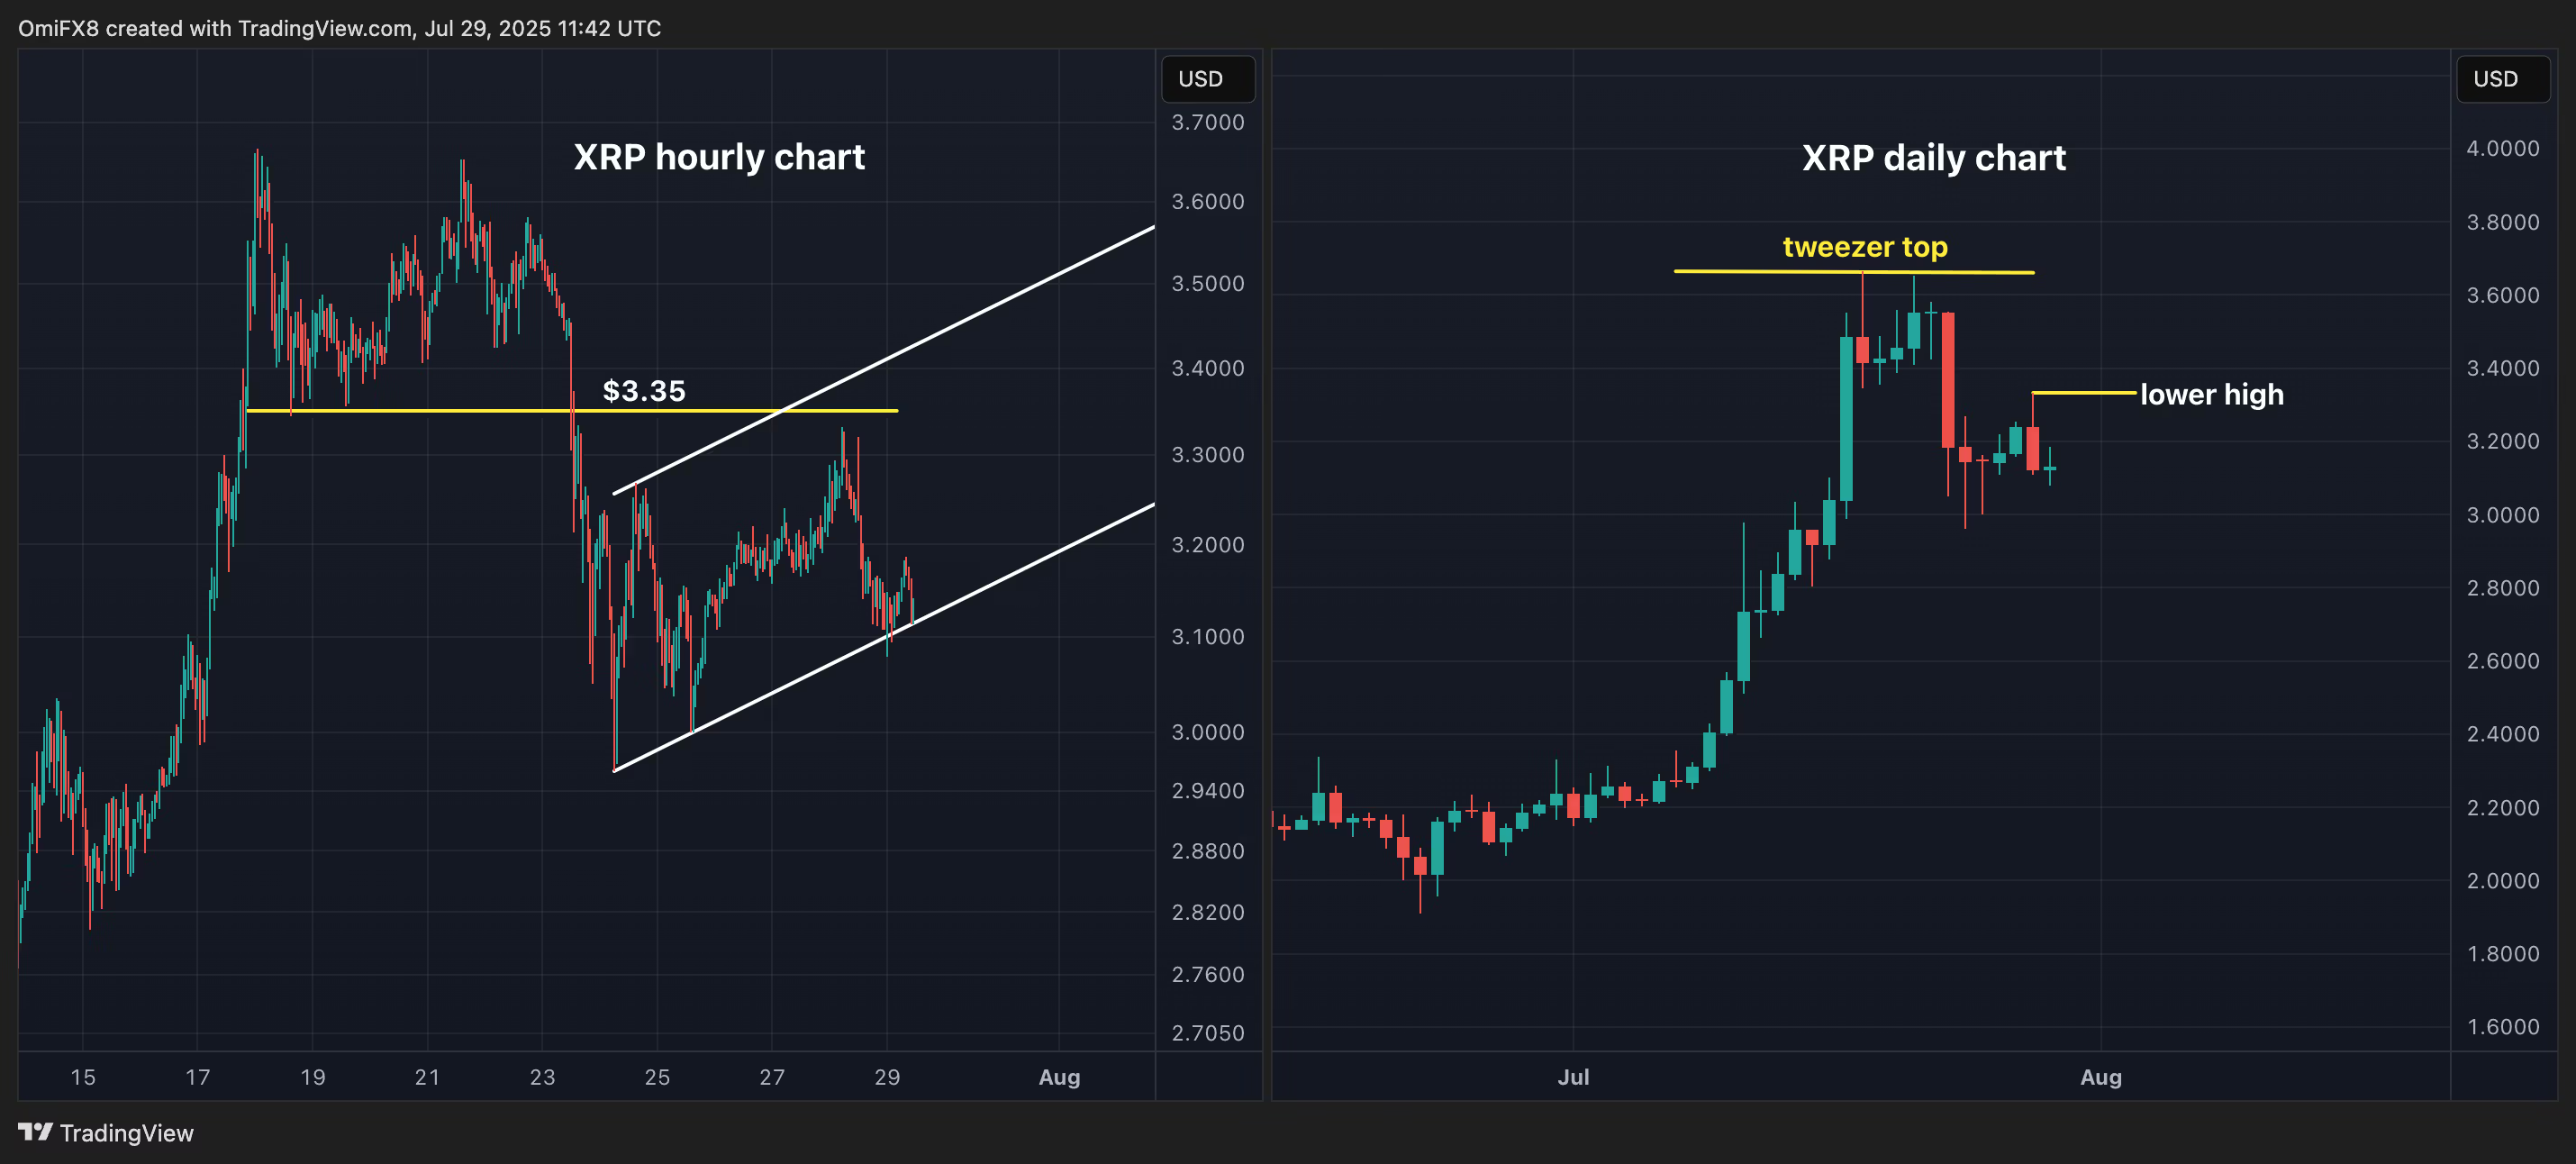
XRP: Lower High Established
XRP fell 3.59%, establishing a lower high at $3.33. This suggests potential downside, with the next support levels at $2.95 and possibly $2.65. The resistance level to watch is $3.35.

- Resistance: $3.35, $3.65, $4.00
- Support: $2.95, $2.65, $2.44
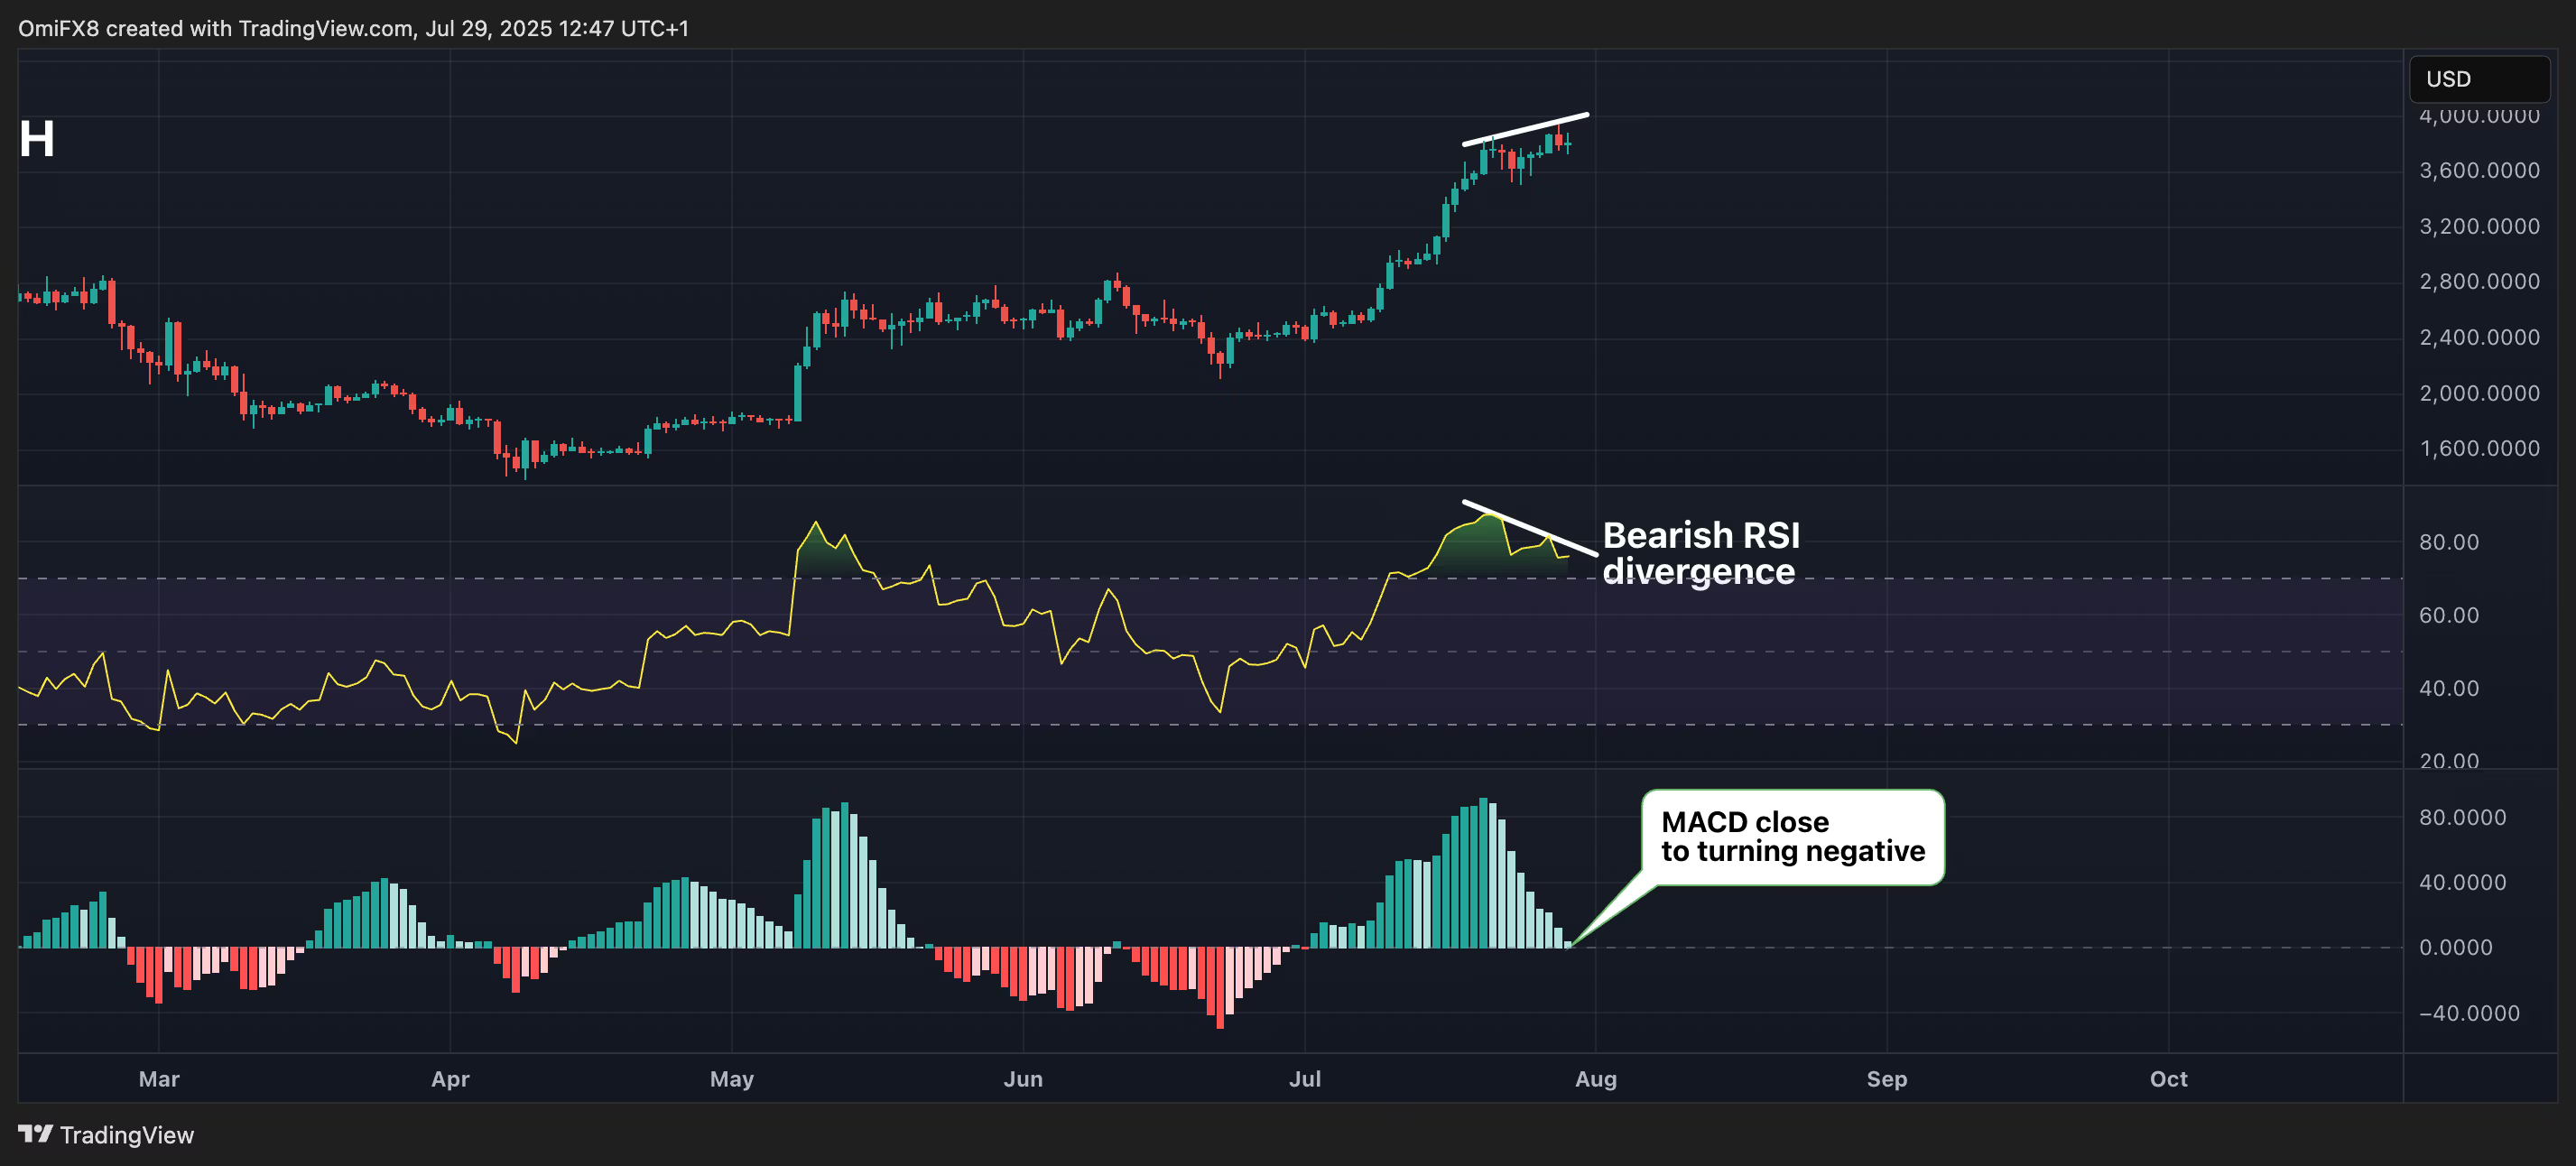
Ether: RSI Diverging Bearishly
Ether's RSI shows bearish divergence, indicating a possible pullback towards $3,510. If this level fails, it could extend to $3,000.

- Resistance: $4,000, $4,100, $4,382
- Support: $3,731, $3,510, $3,000
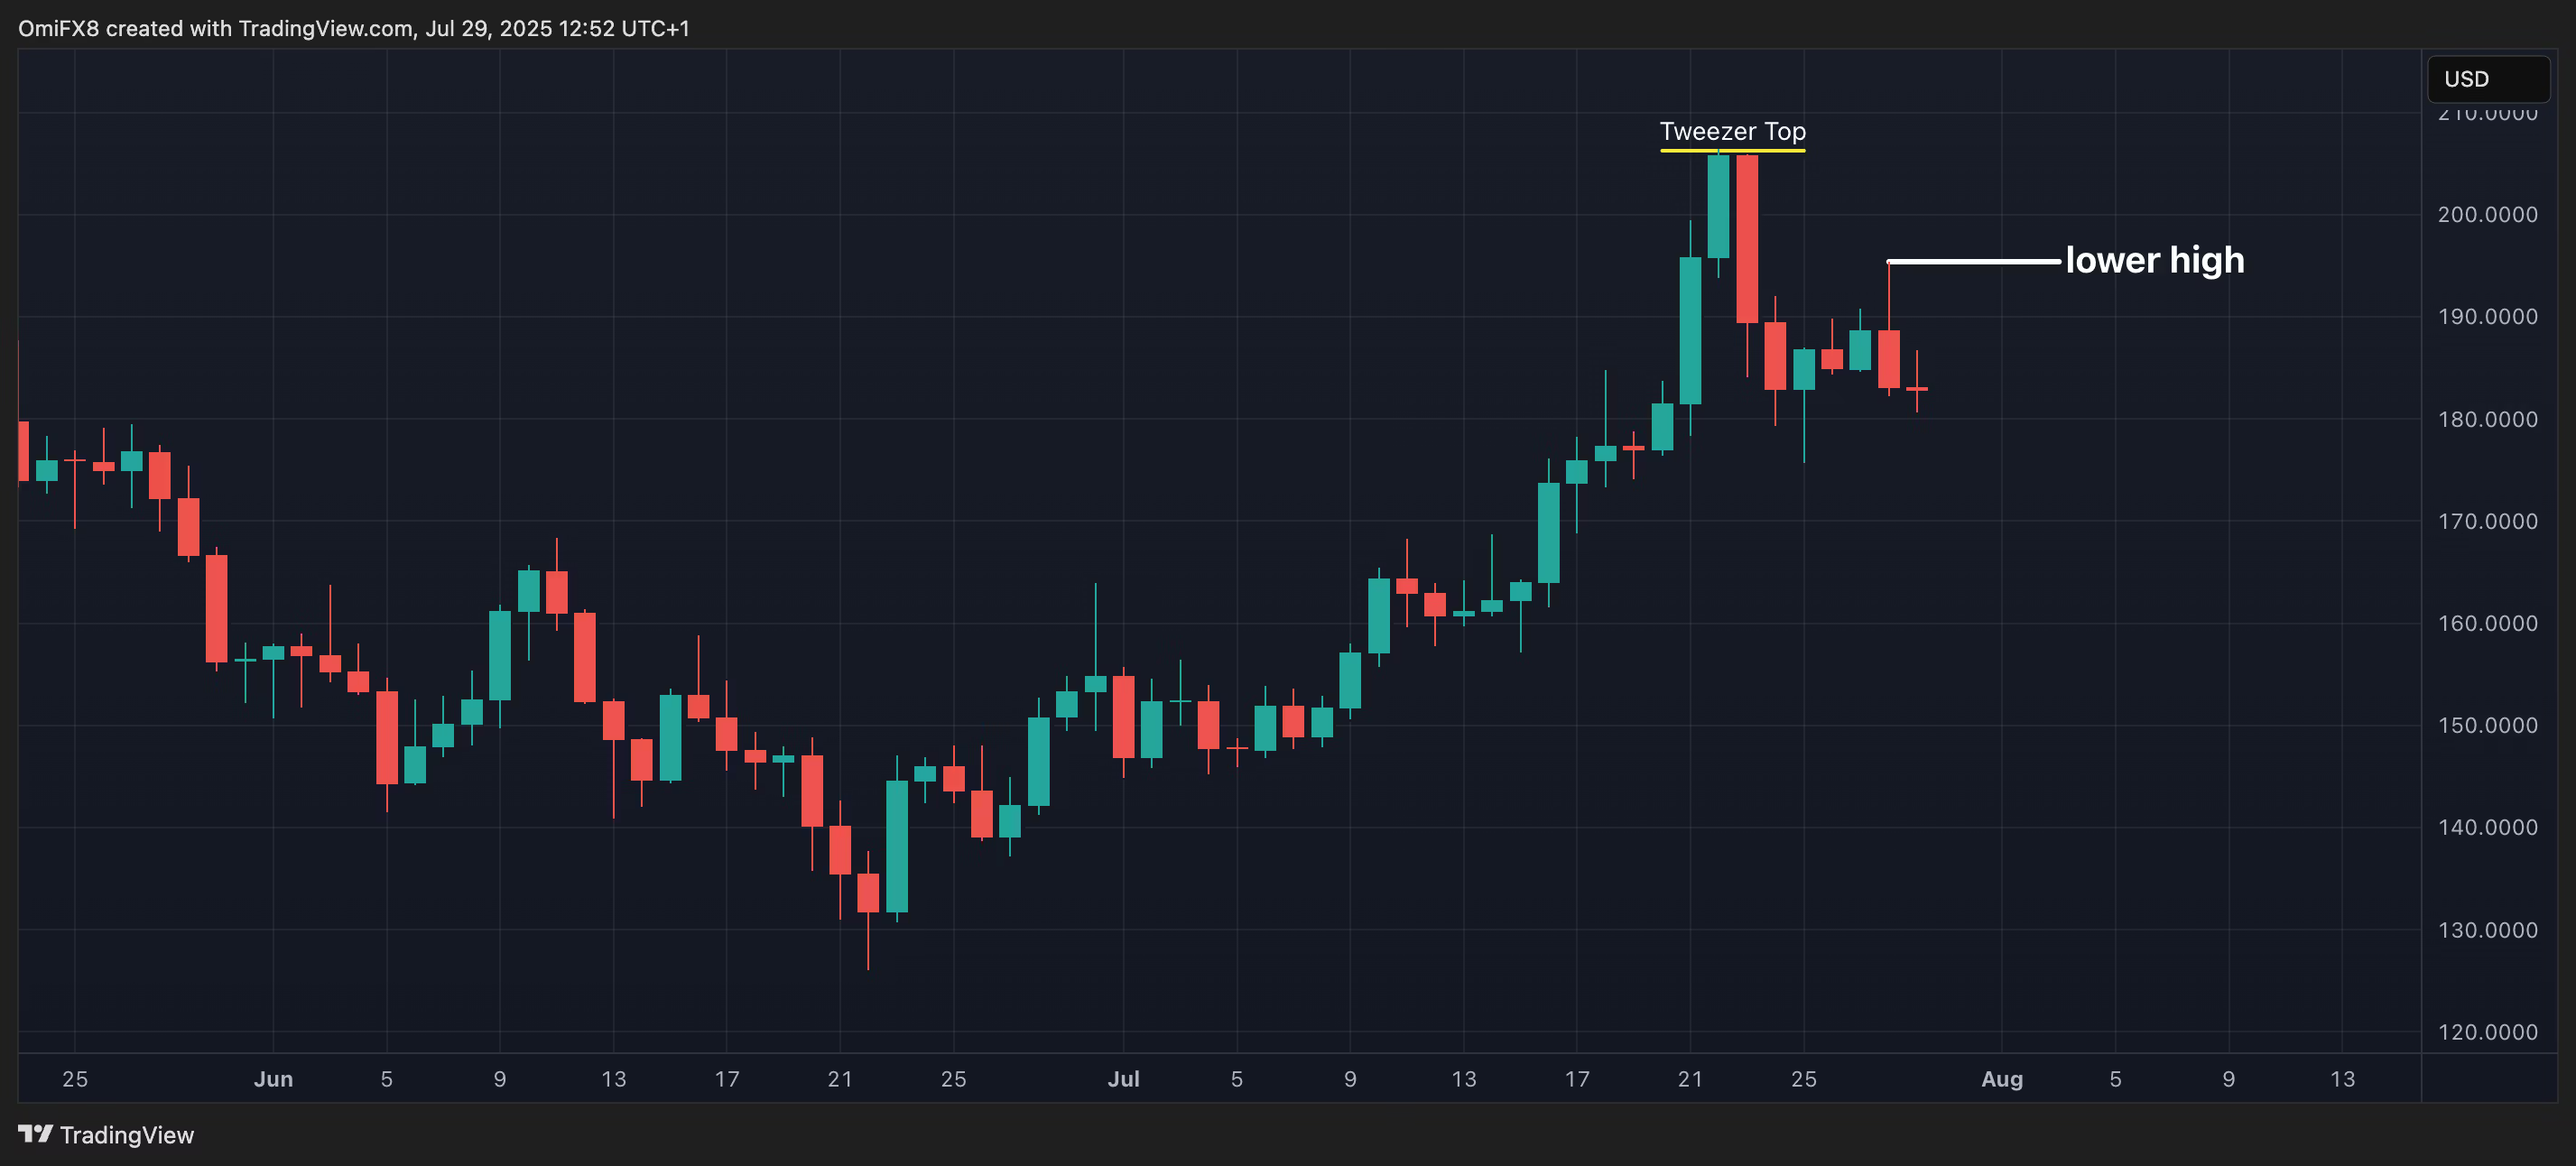
Solana: XRP-like Structure
SOL formed a lower high at $195 and dropped from a mini-ascending channel. Resistance at $195 must be surpassed to shift the bearish bias.

- Resistance: $195, $205-$206, $218
- Support: $184, $163, $126