Jun 24, 2025
6 0
BNB Price Gains Momentum Above $600 Support Level
BNB Price Analysis
- BNB is recovering from the $600 support zone.
- Current price is below $632 and the 100-hourly simple moving average.
- Break above bearish trend line at $625 observed on hourly chart.
- To increase further, BNB must remain above $632.
Price Movement Overview
BNB started increasing after establishing a base above $600. The price moved above $620 and $625 resistance levels.
The price is consolidating near the 76.4% Fibonacci retracement level of the decline from $651 to $602.
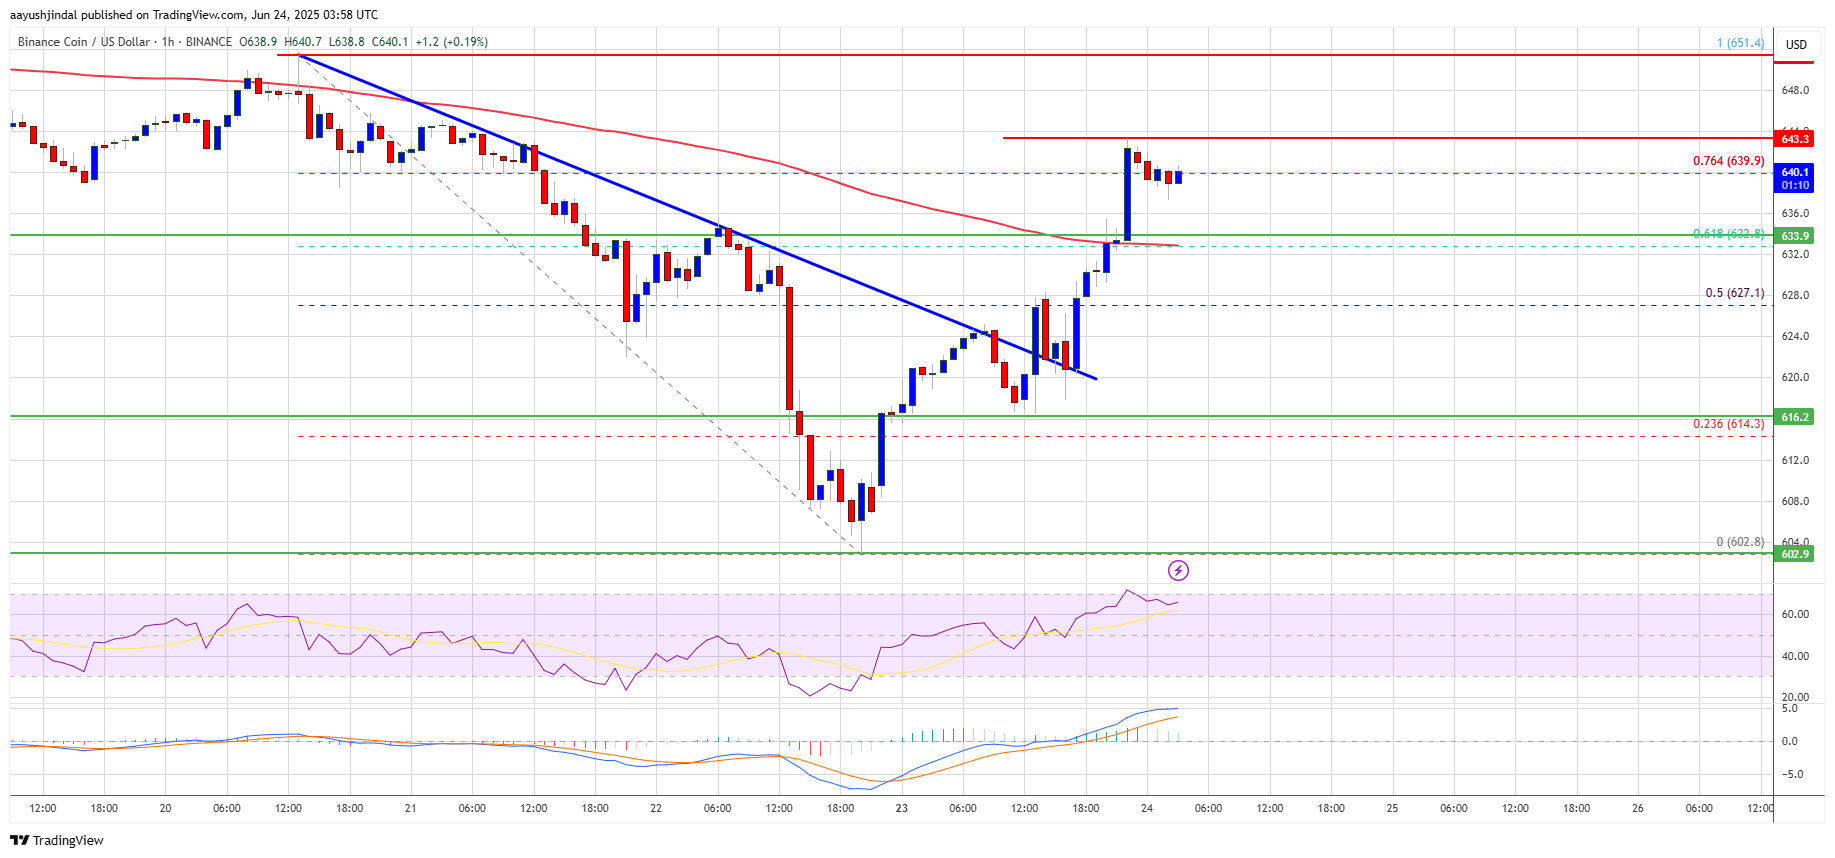
Upcoming resistance levels include:
- $644
- $650
A move beyond $650 could raise the price towards $665 and potentially $680. Further gains may lead to testing the $700 level.
Potential Decline
If resistance at $644 is not surpassed, BNB may decline, with initial support around $635 and major support at $632.
Critical support lies at $625; a break below this level could push the price towards $612 and possibly down to $600.
Technical Indicators
- MACD shows bullish momentum.
- RSI is above 50, indicating positive market sentiment.
- Major Support Levels: $632, $625
- Major Resistance Levels: $644, $650