BNB Price Recovers Above $650, Eyes Resistance at $662
BNB price is recovering from the $630 support zone and is currently aiming for the $680 resistance level.
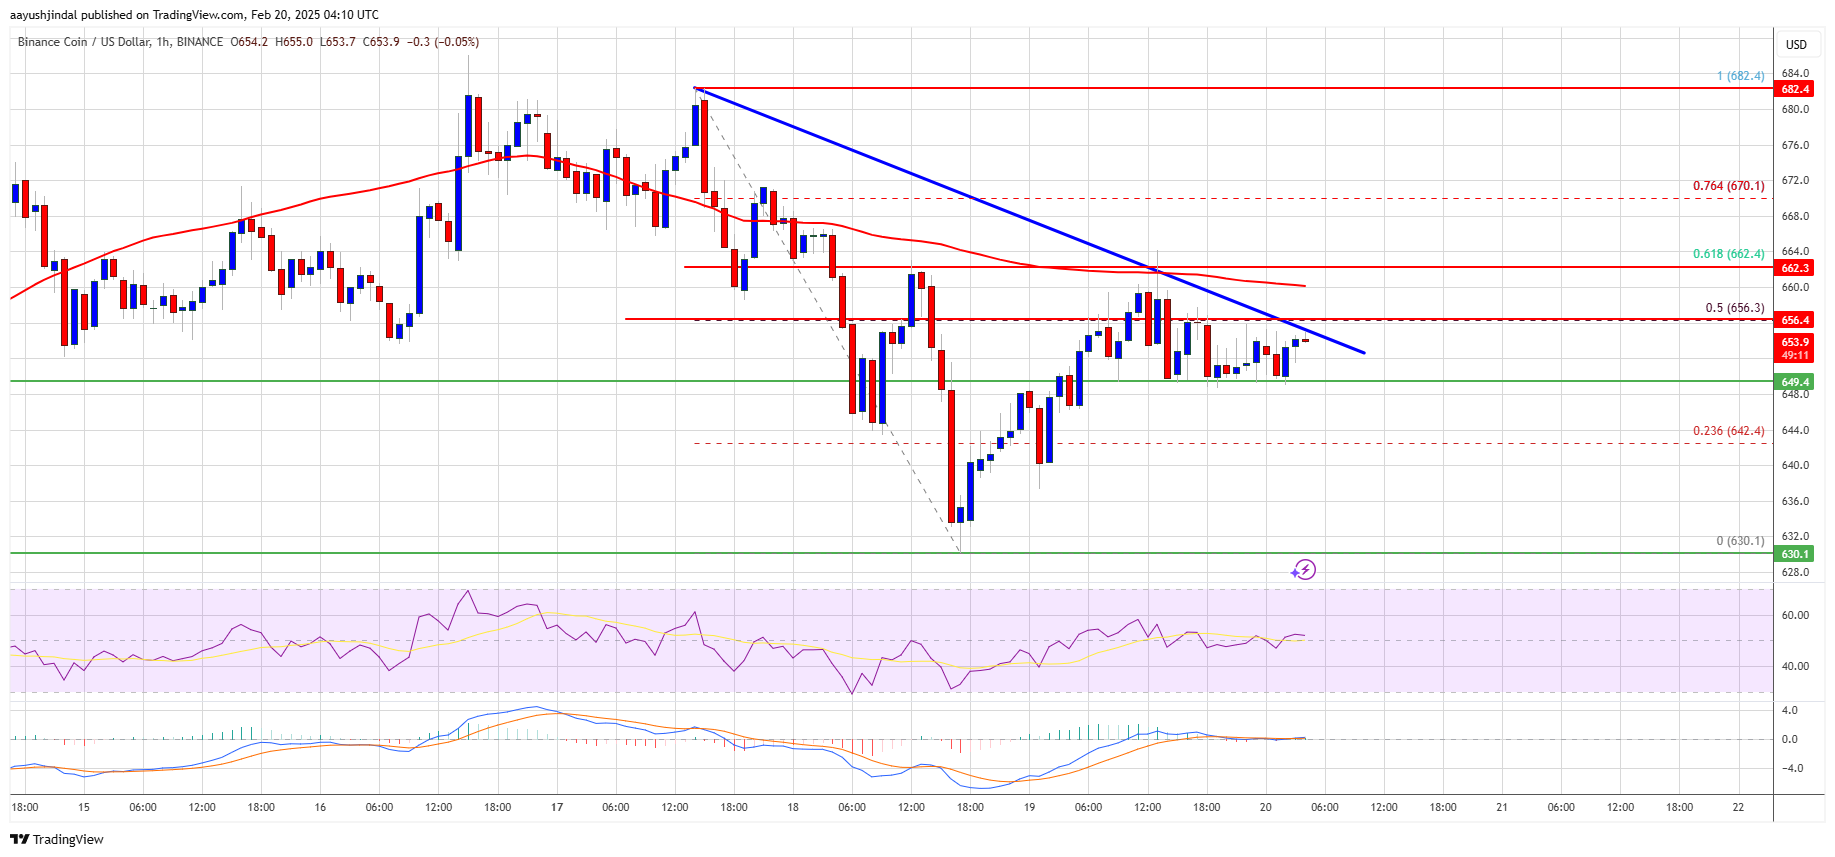
- Price is moving above the $650 resistance zone.
- Current trading below $660 and the 100-hourly simple moving average.
- A bearish trend line with resistance at $655 is forming on the hourly chart of BNB/USD.
- Staying above $650 is crucial for a potential increase.
Price Movement Overview
BNB formed a base above $630, surpassing the $635 and $640 resistance levels. It has recovered past $650, outperforming Ethereum and Bitcoin.
Recent moves have crossed the 50% Fib retracement of the downward trend from $682 to $630. Resistance near $655 and $660 remains due to active selling pressure. The price must clear $662 to target $680, potentially leading to a larger move toward $700.
Potential Decline Scenario
If BNB does not break through $662, a decline may occur. Key support levels include:
- $650
- $642
- $630
A drop below $630 could lead to testing $612 and further losses towards $600.
Technical Indicators:
- Hourly MACD indicates bullish momentum.
- RSI is above 50.
Major Support Levels: $650 and $642. Major Resistance Levels: $655 and $662.