4 0
BNB Price Attempts Recovery Above $575 Amid Resistance Near $600
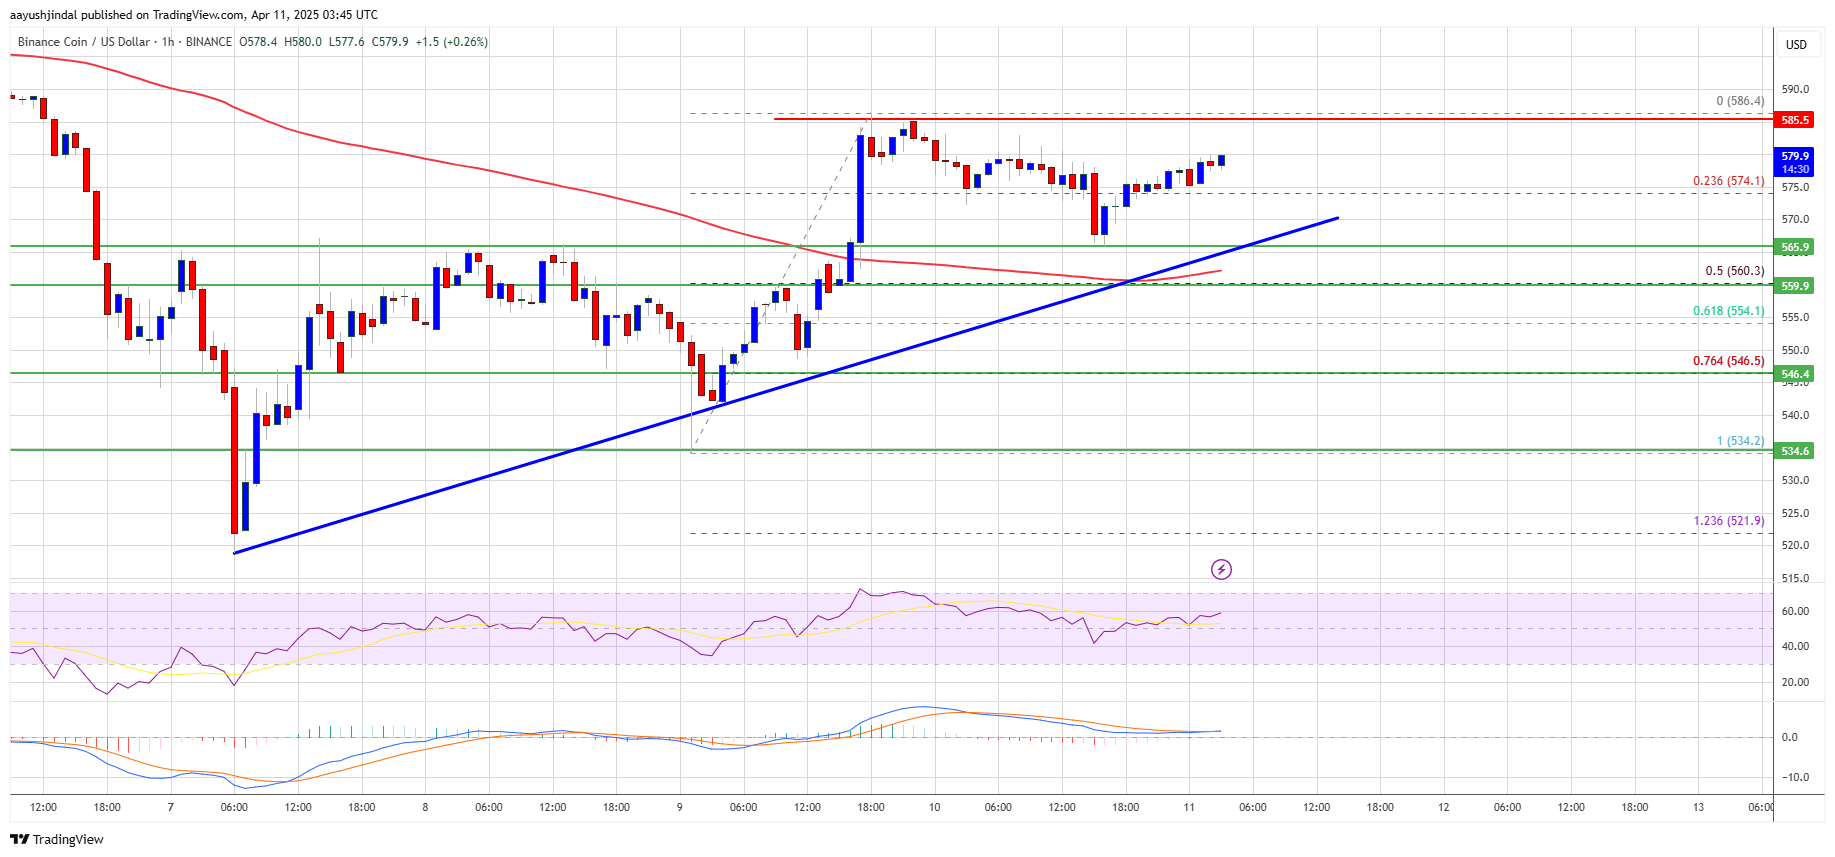
BNB is recovering from the $535 support level, currently consolidating gains. Key price levels include:
- Attempting to recover above $575 resistance.
- Trading above $565 and the 100-hourly simple moving average.
- Support forming at $565 on the hourly chart.
- Must remain above $560 for further upward movement.
Price Movement Overview
BNB has moved above key resistance levels of $550 and $560, reaching a high of $586 before correcting. Currently, it trades below $575 after dipping past the 23.6% Fibonacci retracement level from $534 to $585.
Resistance levels are identified at $580 and $585. A clear break above $585 could lead to a test of $592 and potentially $600. More gains may push towards $620.
Potential Decline
If BNB does not surpass $588, a decline is possible. Key support levels include:
- $570
- $565
- Main support at $560
A drop below $560 could see prices approach $550, with further declines targeting $535.
Technical Indicators
- Hourly MACD is bullish.
- RSI is above 50.
