BNB Price Begins Recovery After Surpassing $585 Resistance
BNB is recovering from the $550 support zone, aiming for an upward movement toward the $635 resistance.
- BNB price has surpassed the $585 resistance.
- Currently trading below $595 and the 100-hourly simple moving average.
- A bullish trend line is forming, providing support at $600 on the hourly chart.
- The pair must maintain levels above $588 for potential increases.
BNB Price Movement
BNB has established a base above $550, with recent gains exceeding $565 and $570. It has recovered above $588, outperforming Ethereum and Bitcoin.
The price moved beyond the 50% Fib retracement level of the decline from the $637 swing high to the $548 low. Resistance is noted near the $605 and $606 levels, while trading remains above $600.
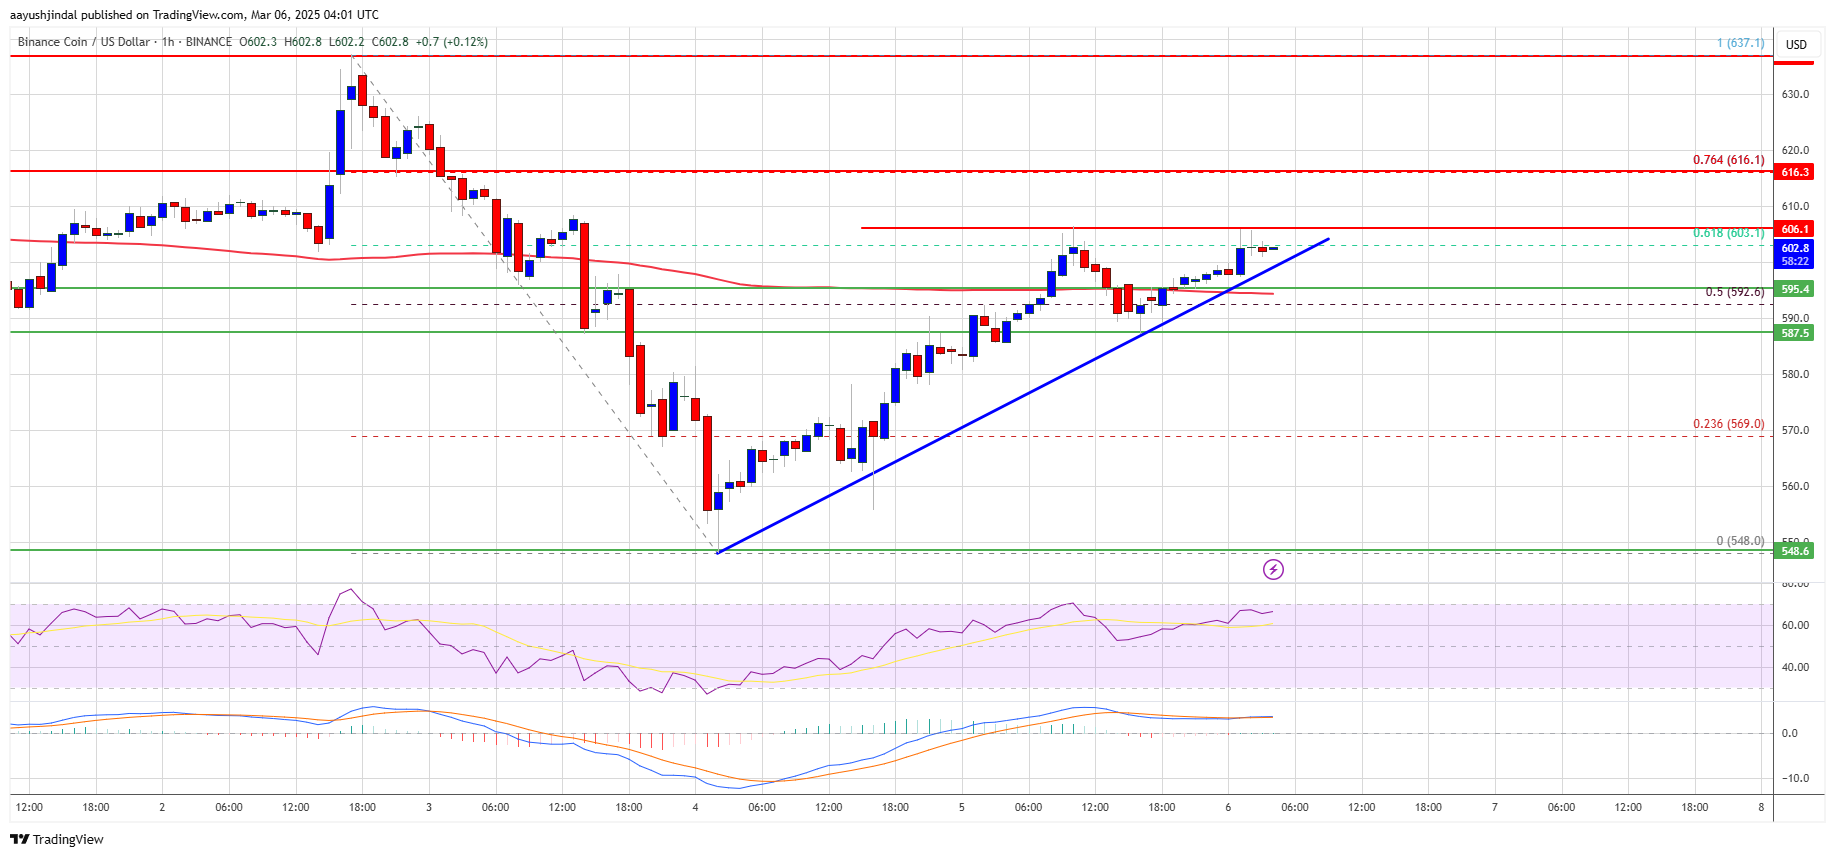
Resistance exists near the $616 level or the 76.4% Fib retracement level. A breakthrough above $616 may lead to testing $635, with further gains potentially reaching $650 or even $665.
Potential Decline
If BNB does not surpass the $606 resistance, it could face a decline. Key support levels are at $600 and $595, with major support identified at $588. A breach below $588 may lead to a drop toward $570 and further losses toward $565.
Technical Indicators
- Hourly MACD indicates bullish momentum.
- Hourly RSI is above the 50 level.
- Major Support Levels: $600 and $595
- Major Resistance Levels: $606 and $616