Sep 12, 2025
8 0
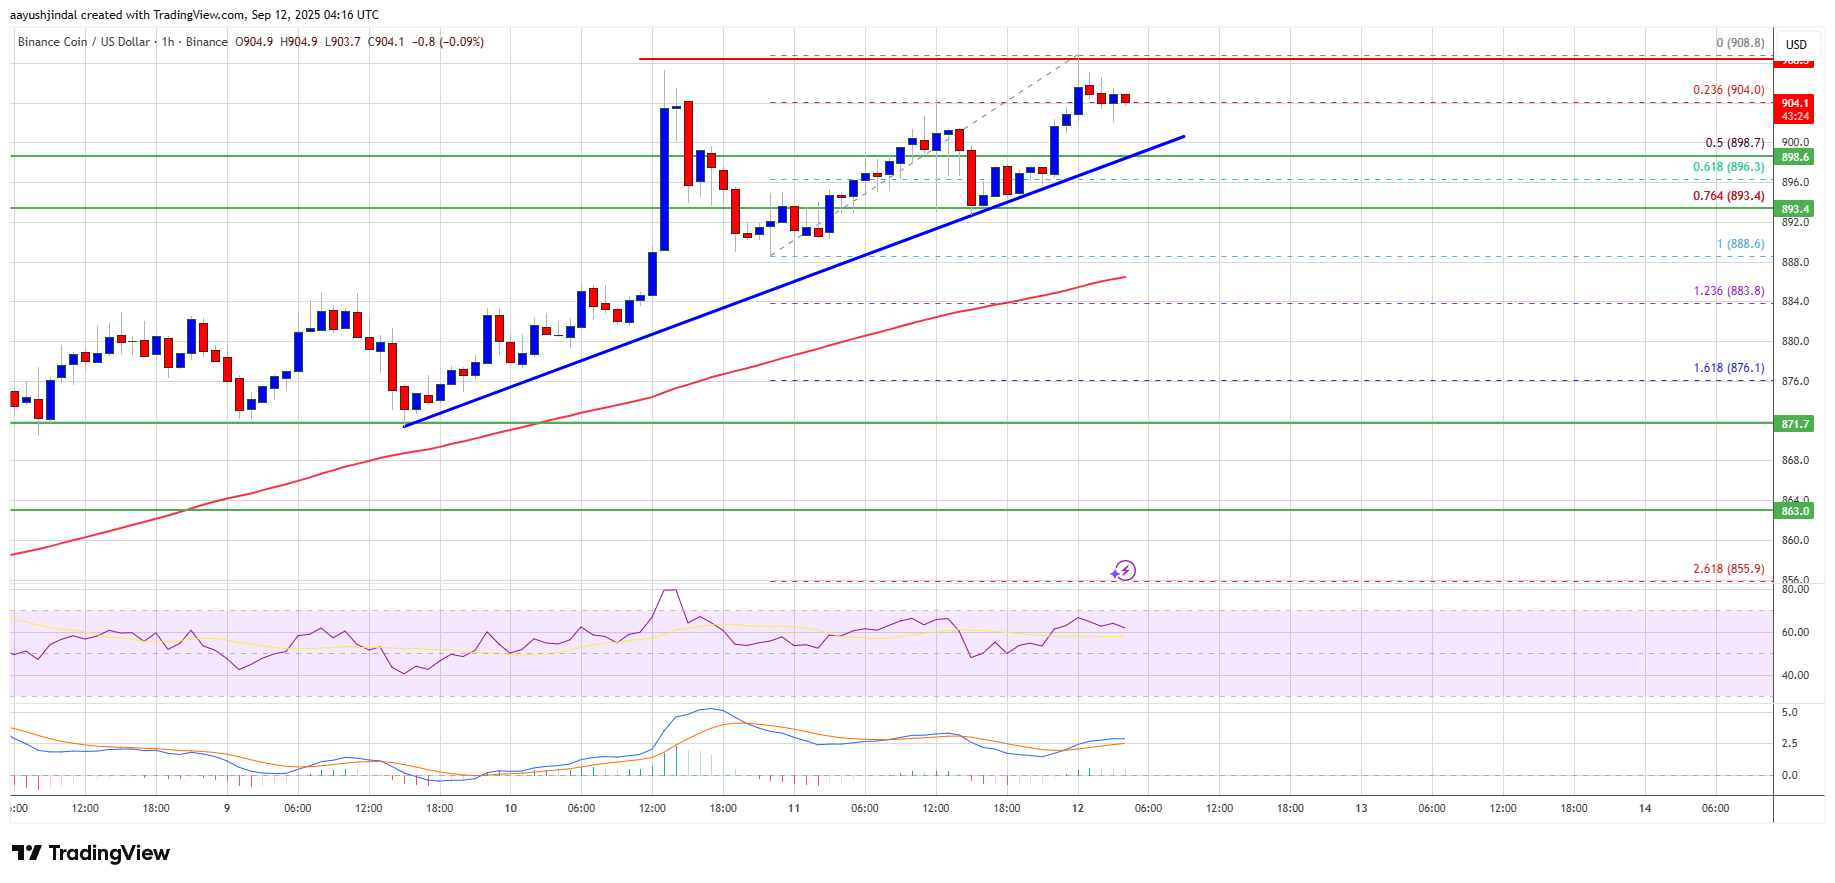
BNB Price Surges Above $900 with Potential Move Toward $920
BNB Price Movement
- BNB is gaining momentum above $885, showing positive signs for a potential rise above $920.
- The price has risen past $880 and $900, currently trading above these levels and the 100-hourly SMA.
- A bullish trend line with support at $898 is forming on the BNB/USD hourly chart.
- The price formed a base above $850, surpassing Ethereum and Bitcoin, moving steadily over $870 and $885.
Recent Developments
- BNB reached a new high of $908, now consolidating near the 23.6% Fib retracement level from $888 to $908.
- Resistance is expected around $908 and $912. A break above $912 could lead to testing $920 and possibly $945.
- A close above $920 may initiate a larger movement towards the $1,000 mark.
Potential Pullback
- If failing to exceed $908, BNB might decline, with immediate support at $898.
- Further support exists at $893 and $888, with a possible drop to $872 or even $865 if breached.
Technical Indicators
- Hourly MACD: Gaining momentum in the bullish zone.
- Hourly RSI: Above 50.
- Key Support Levels: $898 and $888.
- Key Resistance Levels: $908 and $920.