Feb 13, 2026
7 0
BEARISH 📉 : Bitcoin price declines below $67,000 amid bearish trend
Bitcoin Price Analysis:
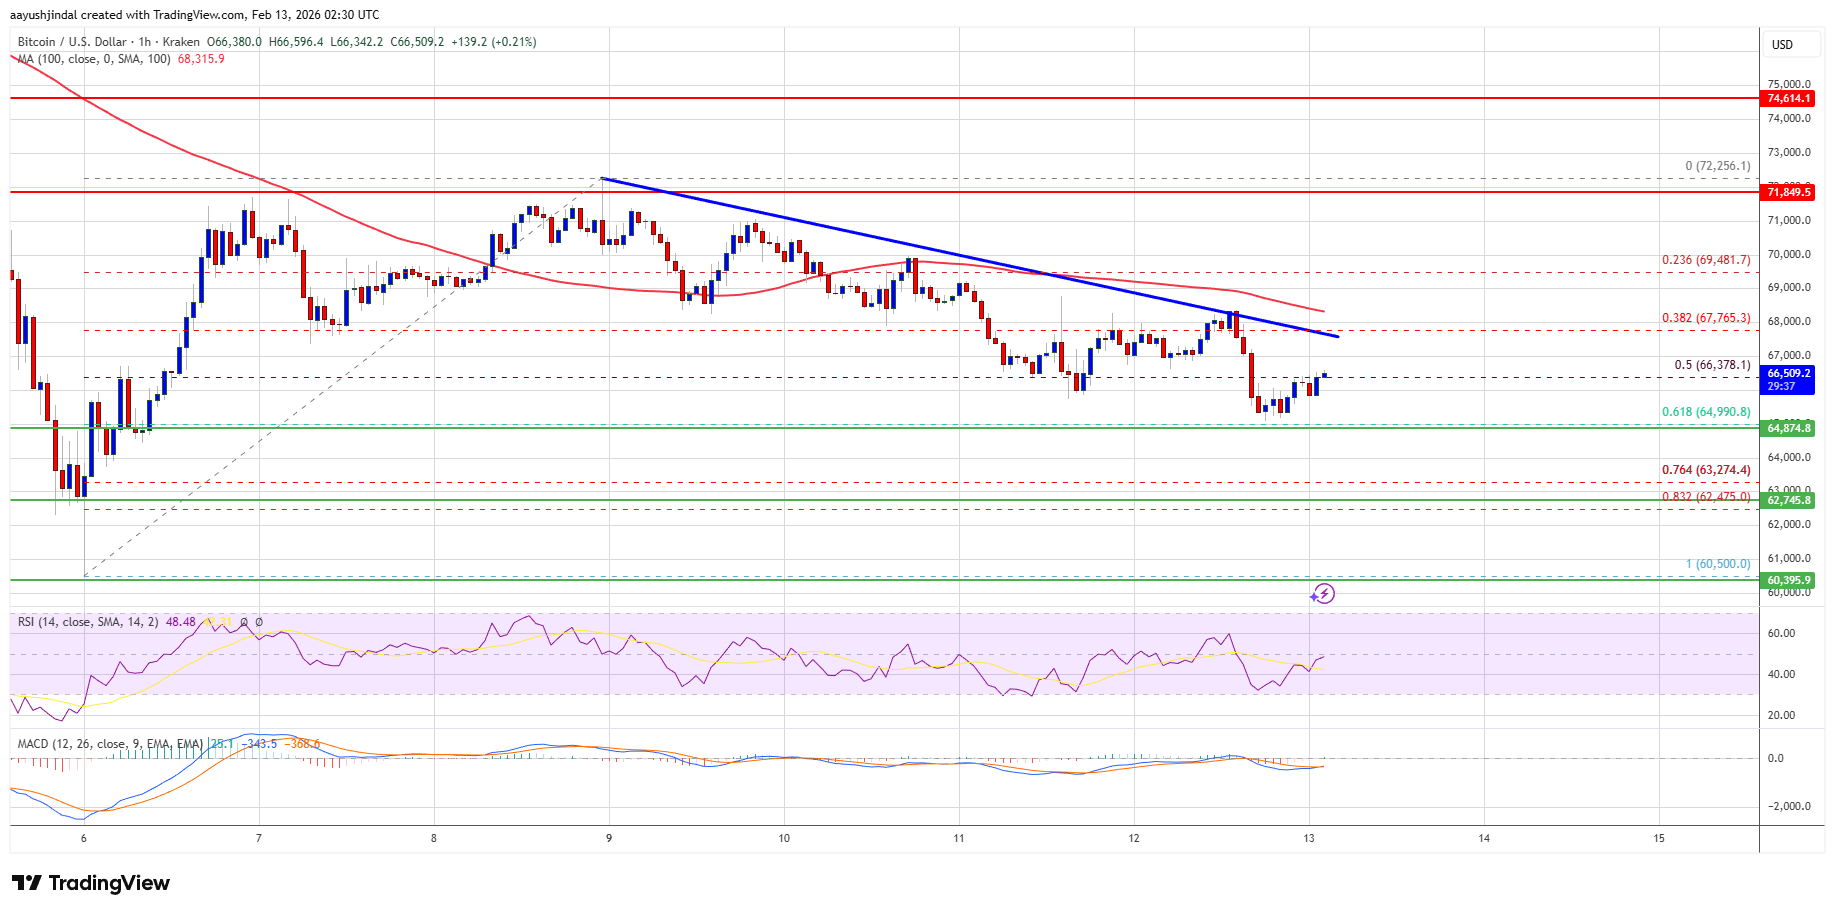
- Bitcoin is trading below $68,000 and the 100 hourly SMA.
- A bearish trend line is forming with resistance at $67,500 on the BTC/USD chart.
- The price dipped below the 50% Fibonacci retracement from $60,500 to $72,255.
Potential Movements:
- If Bitcoin stabilizes above $65,000, a fresh increase may occur.
- Resistance lies at $67,500 and $68,000. A close above $68,000 could push the price towards $69,200 or even $70,500.
Risk of Further Decline:
- If unable to surpass the $68,000 resistance, further decline is possible.
- Support levels are at $65,500 and $65,000; below these, $62,750 and $61,200 are crucial.
- Main support stands at $60,500, critical for recovery prospects.
Technical Indicators:
- Hourly MACD: Gaining pace in the bearish zone.
- Hourly RSI: Below the 50 level for BTC/USD.
BTC continues to face challenges as it attempts to recover above key resistance points.